Sunday, February 26, 2023

History Suggests the Nasdaq Could Soar in 2023

The Nasdaq-100 is home to 100 of the largest technology companies listed on the Nasdaq stock exchange. The index has a remarkable track record, delivering a positive annual return 78% of the time since its inception in 1985.

The tech sector is known for its high-growth nature, and so bearish periods in the Nasdaq-100 tend to be short-lived. The index has only declined in consecutive years on one occasion, and that was during the dot-com bust from 2000 to 2002. Since 2022 was a losing year, history bodes well for a (potentially strong) gain in 2023. 

How strong? Here's what the rebounds looked like after losing years in 1990, 2008, and 2018:

YEAR

NASDAQ-100 RETURN

1991

64.9%

2009

53.5%

2019

37.9%

DATA SOURCE: SLICKCHARTS. 

That's an average return of 52% in the year following a loss (excluding the 2000-2002 period).

The semiconductor sector could be a big winner

No matter the device you're using to read this article, it's powered by advanced computer chips manufactured by the semiconductor industry. These pieces of hardware are growing increasingly important to everyday life. They're inside smartphones and computers we use, but they also drive the incredibly advanced data centers we normally don't see -- the facilities that host (and deliver) our digital experiences. 

Consumers and businesses alike pulled back on their spending in 2022, which resulted in the chip sector underperforming the broader market. The iShares Semiconductor ETF plunged 35% for the year, faring marginally worse than the Nasdaq-100. But it has already gained 21% so far in 2023, and it could accelerate further as the economy -- and the stock market -- recovers. Longer-term, an estimate by Fortune Business Insights suggests the chip sector could be worth over $1.5 trillion annually by 2030.


One Chart That Will Calm Your Inflation-Induced Nerves


Saturday, February 25, 2023

Why did Nvidia (for that matter semiconductors) jumped?

Semiconductor giant Nvidia (NVDA) saw its stock price jump almost 15% today. And a lot of folks can’t seem to understand why… 


After all, its finances were a mess in its most recent earnings report. The chipmaker’s revenues dropped 21% in the quarter, while gross margins compressed by 90 basis points, operating profits fell 40%, net profits declined 35%, and per-share earnings slid 35%. 

In other words, every key operational metric at the company dropped in the quarter. Yet, NVDA stock spiked! Why?

Because this is the bottom for all those key operational metrics.

Remember: Stocks trade on what will happen, not what has happened. They’re discounting mechanisms for the future. Investors look forward, not backward. 

Looking backward, yes, Nvidia’s results were awful. Everything dropped. 

But looking forward… things are going to get a lot better. 

The semiconductor industry in which Nvidia operates is very economically cyclical. It moves with the economy. When the economy is booming, the semiconductor industry is booming, and Nvidia is growing. When the economy is contracting, the semiconductor industry (and by extension, Nvidia) is declining.

In 2022, the economy contracted, so semiconductors followed suit. Hence Nvidia’s bottoming sales and profits.

In 2023, however, the economy is expected to stabilize and even improve. If this proves to be a boon to the semiconductor industry, as is expected, then Nvidia’s sales and profits should rebound. 

At least, that’s what Nvidia’s management team said on last night’s conference call. They sounded pretty optimistic that 2023 will be a lot better than 2022 for the chipmaker. 

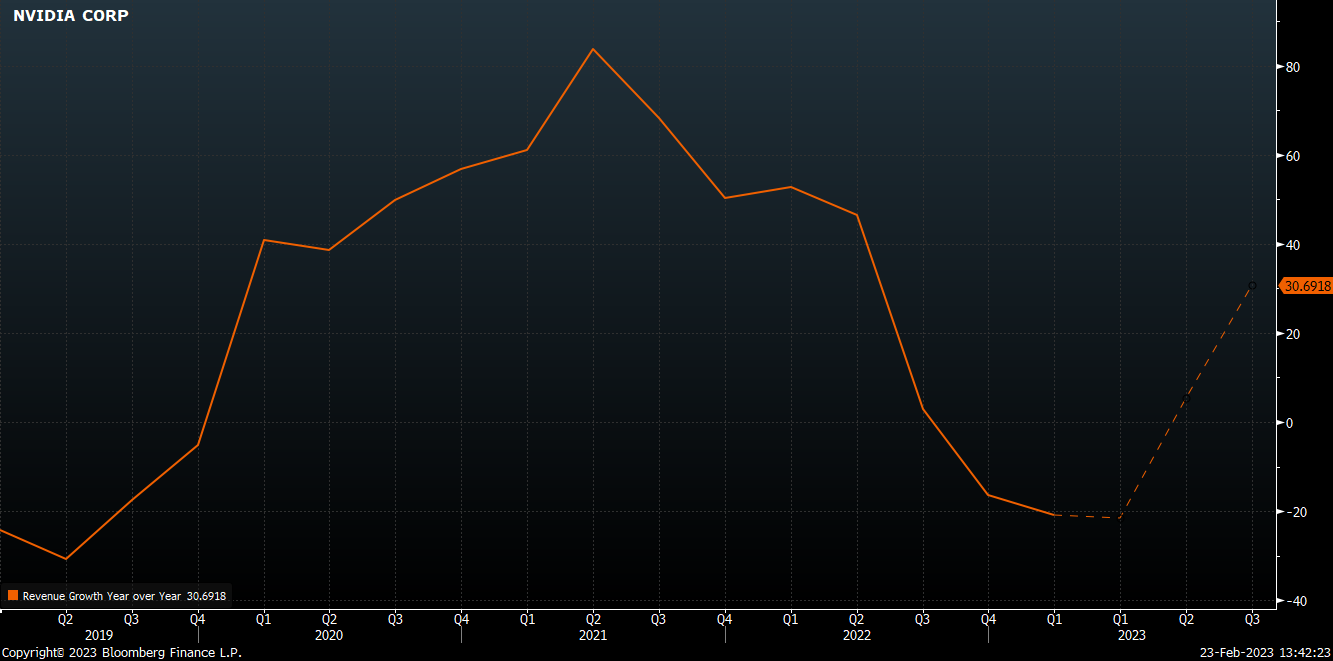
This is best illustrated in the following chart, which graphs Nvidia’s quarterly revenue growth rates. As you can see, revenue growth has been decelerating for several quarters now. But it’s expected to bottom this quarter and bounce back over the next few quarters.

U.S. E- Commerce Sales. A chart showing revenue since 1999 shows upward growth in billions.

This is important because the direction of the company’s revenue growth rates has historically determined the direction of Nvidia stock. 

That is, whenever its revenue growth rates are falling, Nvidia stock tends to struggle. On the flipside, whenever its revenue growth rates are rising, Nvidia stock tends to rally. 

See the chart below. 

U.S. E- Commerce Sales. A chart showing revenue since 1999 shows upward growth in billions.


To that extent, we think Nvidia stock is in the early innings of a big comeback right             now because its revenue growth rates are on the cusp of inflecting meaningfully higher.       


That’s why we own NVDA stock in our Core model portfolio. It’s already up 534% for us,     but we’re sticking with the rally because we see bigger gains on the horizon.                         


To be clear, this phenomenon of slowing revenue growth becoming re-accelerating revenue    growth isn’t unique to Nvidia. It is happening to several companies right now.                          

(adpated from Luke Lango)                                                                                                            

Friday, February 10, 2023

The Infallible Super Golden Cross?

You may have heard that the S&P 500 just triggered a rare “golden cross” signal. And these technical indicators tend to mark the start of big new bull markets


Golden crosses are triggered when a short-term moving average (MA) crosses above a long-term moving average. Typically, for this analysis, investors use the 50-day and 200-day moving averages. Therefore, the typical golden cross signal is triggered when the 50-day crosses above the 200-day MA.

Usually, it’s bullish. 

The operative word there is “usually.” 

Golden crosses are usually bullish. They aren’t always bullish. 

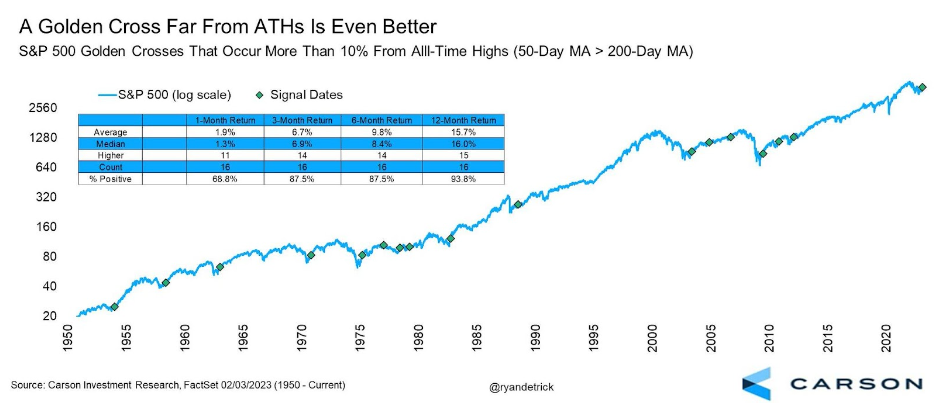
Since 1950, the S&P 500 has experienced 36 different golden crosses. About 80% of the time, stocks are higher a year later, with an average return of about 10%. 

U.S. E- Commerce Sales. A chart showing revenue since 1999 shows upward growth in billions.

Those are good odds. But they’re not 100%. 

When we look at golden cross signals that happened more than 10% off all time highs, the odds look better. That has happened 16 times since 1950. In 15 of those 16 instances (94% of the time), stocks were higher a year later, with an average return of 16%. 

U.S. E- Commerce Sales. A chart showing revenue since 1999 shows upward growth in billions.

Those are great odds. But… 94% is not 100%. 

I’m looking for an indicator with a 100% hit rate. I don’t want any uncertainty. The 2022 bear market was too violent and too bloody for me to accept any room for error. I want certainty, certainty, certainty, and a little bit more certainty – with a side of certainty, if they’ll let me have it. 

And that’s why I created the “Super Golden Cross” signal.

The Super Golden Cross is my modified version of the standard golden cross signal, and it’s infallible. It isn’t 80% or 90% accurate. Going back to 1950, it has a 100% accuracy of predicting bear market endings and bull market beginnings. 

It is triggered only when a convincing golden cross happens after a long bear market. Specifically, the Super Golden Cross is triggered only when the 50-day crosses above the 200-day MA and stays above it for at least three days, after spending at least nine months below it. 

Between 1950 and 2022, this Super Golden Cross signal was triggered only eight times. 

All eight times, it marked the end of a bear market and the beginning of a new bull market.

Every single time. No false signals. 100% accuracy. And average peak returns a year later were huge, on the order of nearly 25%!

The Final Word

U.S. E- Commerce Sales. A chart showing revenue since 1999 shows upward growth in billions.

This Super Golden Cross signal was just triggered this week, for the ninth time in history and the first time since 2009, when stocks proceeded to soar as much as 32% over the following year. 

What’s that thing they say about history? Oh, yes… it tends to repeat. 

History is repeating itself right now before our very eyes. Investors who are paying attention are putting themselves in a position to make huge profits. 

And investors buying the right stocks right now are giving themselves the opportunity to make a small fortune. 


Adapted from Luke Lango