Wednesday, December 20, 2023

Pullback and then rally

 In the 12 months after they become extremely overbought for the first time in a year, stocks rally 85% of the time. And in the following 24 months, they rally 90% of the time. Average returns in the following one- and two-year periods are 16% and 19%, respectively.

U.S. E- Commerce Sales. A chart showing revenue since 1999 shows upward growth in billions.

In other words, after the market becomes this overbought for the first time in a year, stocks tend to pull back over the next month – then soar over the next 12 and 24 months. 

That’s the pattern that was signaled yesterday. 

And that means stocks will likely fall in January – before they absolutely soar throughout the rest of 2024. 

You need to buy that dip. 


Adapted: Luke Lango 20 Dec 2023

Friday, October 20, 2023

Global Semiconductors: Place Your Chips to Ride on Recovery Wave (adapted from DBS)

 Green shoots are starting to emerge in the end markets

Chief Investment Office27 Sep 2023
  • Global semiconductors shipments to experience further upside ahead
  • Boom in AI driving demand for memory chips used by servers and data centres
  • Green shoots appearing in end markets - bottoming PC shipments and improving mobile shipments
  • Easing concerns on Tech's valuation premium amid recent upward earnings revision
  • Preference for upstream companies offering stable mid-to long-term growth drivers
Photo credit: iStock

Global semiconductors industry on a recovery path. Global semiconductors shipment is on the rise and the drivers are:

  1. Bottoming of demand for memory chips: Demand for memory chips (previously the worst-hit) has bottomed and this segment is expected to lead the rebound for the semiconductors industry going forward. Artificial intelligence (AI) boom is driving demand for memory chips used by servers and data centres which require a large amount of memory capacity. For instance, an AI server possesses 6-8 times DRAM content as well as 3 times NAND content of a regular server.
  2. Positive flywheel effect through AI: The AI semiconductor segment is projected to grow at a CAGR of 22% in 2022-2027 (vs. 4.6% for the broader market). Apart from data centres, the other beneficiaries of AI include equipment makers and memory chip manufacturers. Every 1% increase in AI server penetration in data centres is expected to translate to USD1-1.5b of wafer fab equipment investment.
  3. Inventory destocking: Inventory destocking is on track and the process is expected to bring inventories back to normalised levels by 4Q23.

Green shoots sprouting for end markets; Improvement in macro outlook. Green shoots are starting to emerge in the end markets and they are: (a) 2Q23 saw sequential rebound in PC shipments (at +7.9% q/q) and this points to a bottoming of the PC market, (b) The decline in shipments for the mobile segment has narrowed compared to previous quarters, and (c) The server segment is seeing higher-than-usual GPU server shipments.

On the macro front, meanwhile, the outlook for electronics exports (in particular, for Singapore and Taiwan) is improving as well.

Preference for upstream semiconductors companies offering sustainable mid- to long-term growth. Prevailing market concerns on Tech’s valuation premium have eased amid recent upward earnings revisions, in particular for index heavyweights like Nvidia. This is a positive development given the tendency for valuation to either trade near or exceed its previous peak. Indeed, the sub-segments that registered sharp valuation expansion since the trade war include equipment makers, IDMs (integrated device manufacturers), and foundries.

On balance, we have a preference for upstream semiconductors companies offering stable mid- to long-term growth drivers.

Figure 1: Global semiconductor shipments bottoming


Source: Semiconductor Industry Association, CEIC, DBS

Thursday, October 5, 2023

The Technicals Say It's Time to Buy This Stock Dip


Since late July, the stock market has been in free fall, dropping as much as 8% in what matches its biggest correction of the year. 

But yesterday, some major technical signals were triggered. And they collectively suggest that stocks have hit a bottom – and that it is time to start aggressively buying this stock dip.

Analyzing This Stock Dip & Its Bullish Technical Setup

For starters, the S&P 500 is now closing in on its 200-day moving average. Last night, the index closed at 4230. And its 200-day moving average sits just above 4200. 

Back in March of this year, the S&P 500 commandingly retook its 200-day moving average. And this is the first time since then that the market has fallen back to the 200-day. 

That’s a bullish technical setup. 

Typically, the 200-day moving average serves as a very solid line of defense during selloffs. That is, stock market corrections tend to bottom at the 200-day moving average. Therefore, this one should prove no different.

Meanwhile, the S&P 500 has also dropped to its major “new bull market” support line. 

Following 2022’s nasty bear market, the market then finally bottomed in October of last year. And since then, stocks have surged higher in a very clearly defined uptrend channel. With yesterday’s selloff, the S&P 500 has dropped to the bottom-side of this channel. 

The last time the market dropped to the bottom-side of this channel? Back in March 2023 – right as the February stock market selloff was ending and right before stocks surged higher from April to July. 

That suggests that stocks should bounce here.

Wednesday, September 27, 2023

The S&P is poised to test two big technical levels … the Toxic Trifecta continues pummeling the market

The S&P faces two major tests that will make or break its short-term direction.

The first is its multi-month trendline.

As you can see below, the S&P is about to test the backbone of this year’s bull market.

Chart

This long-term trendline falls at roughly 4,260. With the S&P trading at 4,288 as I write Tuesday morning, we’re less than a percent higher.

If the S&P loses this support line, the trend break would suggest more weakness to come.

However, if we bounce, it would be a significant sign of strength. We’d likely see some emboldened bulls jump back into the market in expectation of a budding relief rally.

The second test would occur if the S&P fails the first test

In that case, we’d be looking to see if the S&P can find support at its long-term 200-day moving average (MA).

To make sure we’re all on the same page, a 200-day MA is a line on a chart showing the average of the prior 200 days’ worth of asset prices. It’s an important psychological line-in-the-sand for investors and traders.

When the asset’s price is above the 200-day MA, many traders interpret it as a sign that sentiment is bullish. The bearish opposite is true when asset prices are below this level.

Since many trading algorithms base their buy-and-sell decisions on the interplay between an asset’s price and its 200-day moving average, this is an important long-term technical level.

As you can see below, the S&P is barely 2% above this important 200-day MA.

Chart

If we lose this support level, we’re likely in for an acceleration of losses as risk-off sentiment spreads among traders.

Holding it and bouncing would open the door to renewed bullishness.


As to which way the market will break, keep your eye on the Toxic Trifecta

Here in the Digest, the “Toxic Trifecta” is the name we’ve given to the combination of the surging 10-year Treasury yield, the soaring cost of oil, and the climbing U.S. Dollar Index.

Today, we’re not seeing any meaningful relief from this damaging threesome.

As you can see below, the 10-year Treasury yield has been exploding, coming in at nearly 4.52% as I write. Back in April, it was as low as 3.25%.

(The chart below shows yesterday’s closing price.)

Chart

Over in the oil patch, though the price of West Texas Intermediate Crude is off its recent high of roughly $93, it remains at $89.

That’s plenty high to inflict pain on business operating costs and family budgets.

Chart

Finally, the U.S. Dollar Index continues climbing.

For newer Digest readers, the dollar index is a measure of the value of the U.S. dollar relative to the value of a basket of six major global currencies – the euro, Swiss franc, Japanese yen, Canadian dollar, British pound, and Swedish krona.

It’s now above $106, the highest level in six months.

Chart

Until we see a pullback in this Toxic Trifecta, the market will struggle to return to bullishness.

Luke Lango is laying the market’s recent underwhelming performance at the foot of the Fed

Luke is our hypergrowth expert and the analyst behind Innovation Investor. While most analysts were caught off guard by this year’s gains, Luke has been a roaring bull since late 2022. But in the wake of last week’s Federal Reserve meeting and Chairman Powell’s comments, he’s modifying his forecast.

Luke’s broad takeaway is that “until the Fed breaks from [it’s “higher for longer”] messaging, stocks will remain sluggish.”

Let’s jump to his Daily Notes in Innovation Investor for more:

Due to the Federal Reserve’s actions, it is our belief that the new trajectory for the stock market is cause for an update of our investment strategy. 

In short, before the Fed’s hawkish commentary [last week], we were near-, medium-, and long-term bullish. We were bullish all around.

Now, after that hawkishness, we are short-term bearish but still medium- and long-term bullish.

Practically speaking, this means Luke isn’t recommending a “buy the dip” approach in the next handful of weeks. Instead, it’s a slightly tweaked approach: “Wait for the right moment to buy the dip aggressively.”

Luke and his team are monitoring the technical and fundamental trends underlying the stock market right now with the goal of identifying that “right moment.”

Here’s Luke:

…When it appears, we’ll let you know immediately – and go on a huge shopping spree. 

Because a golden buying opportunity is coming.

How high is the market headed once bullishness eventually returns?

In answering this, Luke points toward earnings estimates and historical price-to-earnings ratios.

Back to Luke’s Daily Notes:

Earnings growth is expected to inflect from negative this year to positive next year and stay positive in 2025. That’s bullish. 

If you run the math on those future earnings estimates, it becomes clear that – so long as those estimates prove true – stocks will soar over the next 15 months. 

The 2025 EPS estimate for the S&P 500 is $290. The S&P 500 has averaged a forward earnings multiple of 17.5X over the past 15 years, and 20X over the past five years. 

At the lower end, a 17.5X forward multiple on 2025 EPS estimates of $290 implies a 2024 price target for the market of 5,075 – about 16% above where we currently trade. 

At the upper end, a 20X forward multiple on 2025 EPS estimates of $290 implies a 2024 price target for the market of 5,800 – about 33% above where we currently trade. 

Either way, if 2025 EPS estimates are to be believed, then stocks have huge upside potential over the next 15 months. 

To me, the key phrase from Luke is “so long as those [earnings] estimates prove true.”

And that brings us full circle to the Toxic Trifecta from earlier in today’s Digest

The 10-year Treasury yield, a loose proxy for borrowing costs, impacts how much companies must pay to finance their growth – affecting earnings…

The cost of oil directly impacts countless corporate Profit & Loss statements by pushing operating expenses higher – affecting earnings…

And the climbing U.S. Dollar undercuts the value of profits generated outside U.S. borders due to currency headwinds – affecting earnings…

The big question is “how much?”

If we see relief from the Toxic Trifecta as we head into 2024, then bullish earnings estimates have a far better shot at materializing.

Now, though we’ve just been talking about long-term earnings, our most immediate clue will come from Q3 earnings season that begins in two weeks with the big banks reporting. JPMorgan will post its results on Friday the 13th. Let’s try not to read anything into that date.

Here’s Luke’s market forecast to take us out:

We believe the Fed will shift toward dovishness, but it will take weeks (not days) and several weak economic reports (not just one) to get it to embrace such a stance. 

Once it does, stocks will rally. But until then, stocks will remain choppy – hence our short-term cautious but medium- and long-term bullish outlooks…

But on a medium-/long-term basis, everything still looks very healthy. 

So, just embrace this volatility because it will create opportunity. Not yet. But soon. And when the bottom does arrive – likely in October – the rally on the other side will be very big and very fast. 


Thursday, May 25, 2023

AI to power the next bull run?


AI Is Sending Tech Stocks to the Moon

In the early 1990s, it was the internet. The world’s first website was launched in August 1991. Wall Street started to grow really excited about the internet’s economic potential. Internet stocks like Cisco (CSCO) and Oracle (ORCL) rose more than 100% in 1991. 

In the early 2020s, it is AI. The world’s first true AI application was launched in November 2022 with ChatGPT. Ever since, Wall Street has become obsessed with AI’s economic potential. Leading AI stocks like C3.ai (AI) have jumped more than 100% so far in 2023. 

The parallels are too strong to dismiss – and the comparison has strong implications for investors. 

The 1991/92 stock market crash and subsequent internet-powered rebound set the stage for the biggest tech bull market the world has ever seen. From 1992 to 1999, the entire Nasdaq Composite rallied nearly 600% as investors salivated over the long-term economic potential of the internet. 

We believe the data suggests that the 2022/23 stock market crash and subsequent AI-powered rebound similarly set the stage for a huge tech bull market to develop over the next several years. We wouldn’t be surprised to see the Nasdaq pop more than 500% between 2023 and 2030 as investors salivate over the long-term economic potential of AI. 

quantum computing

In other words, we think AI is about to power another dot-com boom in tech stocks. 

If so, savvy investors could make fortunes over the next few years. 


Saturday, April 29, 2023

The time to buy semiconductors is now! (adapted from Fundsupermart)


Stop trying to catch the bottom. The time to start buying semiconductor stocks is now

In this article, we revisit our investment thesis for chipmakers and remind investors why the semiconductor industry should always be on your watch list.

  •  
  • |
  •  
  •  Published on 21 Apr 2023

Stop trying to catch the bottom. The time to start buying semiconductor stocks is now | Open a FREE FSMOne account and manage all your investments conveniently in ONE place
Photo by Praveen on Unsplash

Semiconductor stocks have been on a ferocious rally, rising by more than 20% year-to-date. Earnings estimates, however, have not managed to keep up, and that has led to more expensive valuations for chipmakers. 

The semiconductor industry is currently in a down-cycle. We expect sales growth to fall further in the coming quarters as the inventory correction continues.  

Down-cycles do not last forever, and sales will eventually recover to higher levels than before. The long-term structural trends that underpin semiconductor demand remain intact as well. 

The best buying opportunities come about during down-cycles. Even though valuations are not the cheapest at the moment, investors can consider building a position using a regular savings plan, before switching to lump-sum investments in the future. 

Our target price for the VanEck Vectors Semiconductor ETF is USD 317, which represents an upside potential of close to 26% as of 20 April 2023.


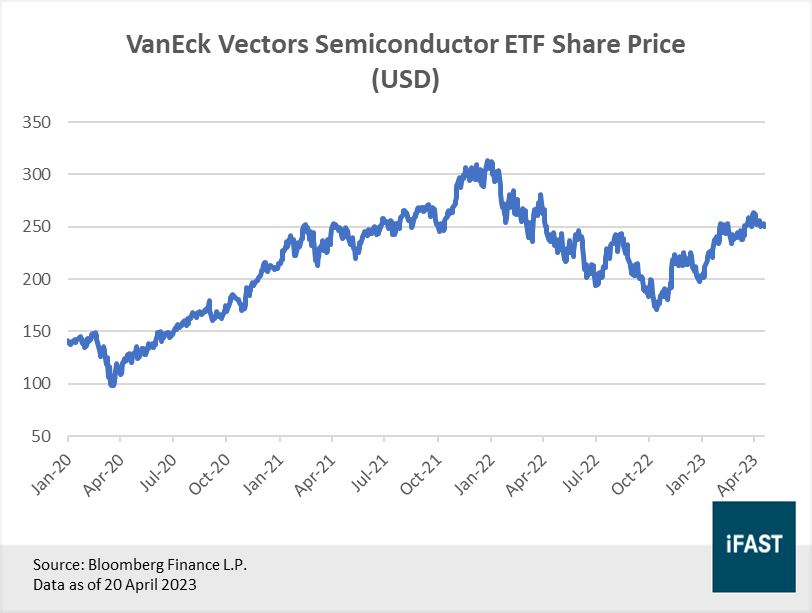
Lately, chip stocks have been on a ferocious rally. The VanEck Vectors Semiconductor ETF (NASDAQ:SMH) – a basket of 25 US-listed semiconductor stocks – has risen by more than 20% year-to-date, placing the semiconductor industry among one of the top-performing sectors this year (Figure 1). However, as earnings estimates have not been able to keep up with the surge in share prices, valuations for the sector have become expensive once more. This is a headache for those who have been sitting on the sidelines, waiting for an opportunity to take a position. 

We are here to tell you that there are still ways for you to do so, but more importantly, remind investors why it is in your interest to always have this sector on your watch list. 


Figure 1: Share prices of chipmakers have risen by about 20% since the start of the year


The semiconductor industry is currently in a down-cycle 

On the whole, 2022 has been a superb year for the entire US chipmaking industry, with record-high revenues and double-digit earnings growth the norm for many players. Unfortunately, good times will not last forever and by the second half of the year, there were clear signs that the industry was sliding into a downturn. 

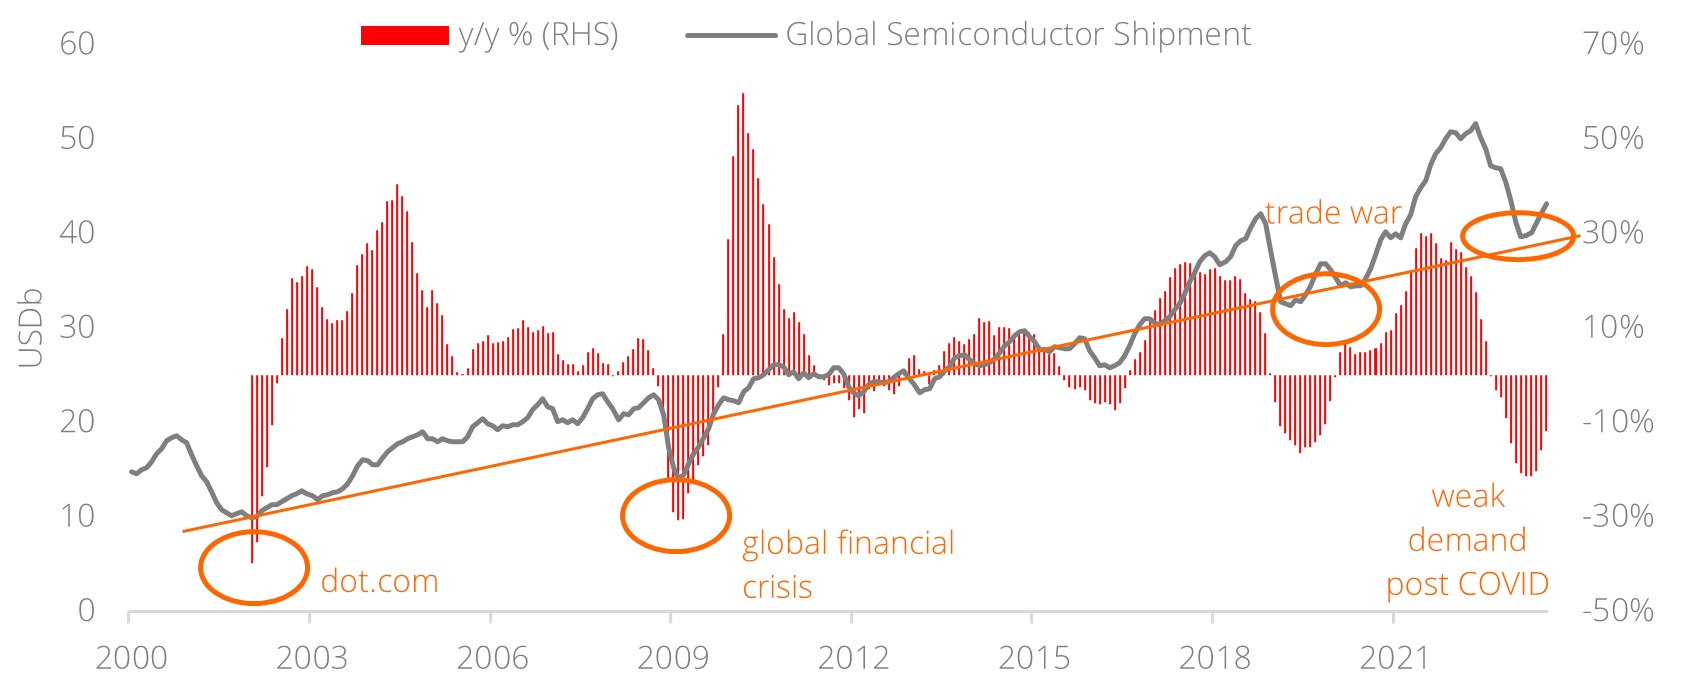
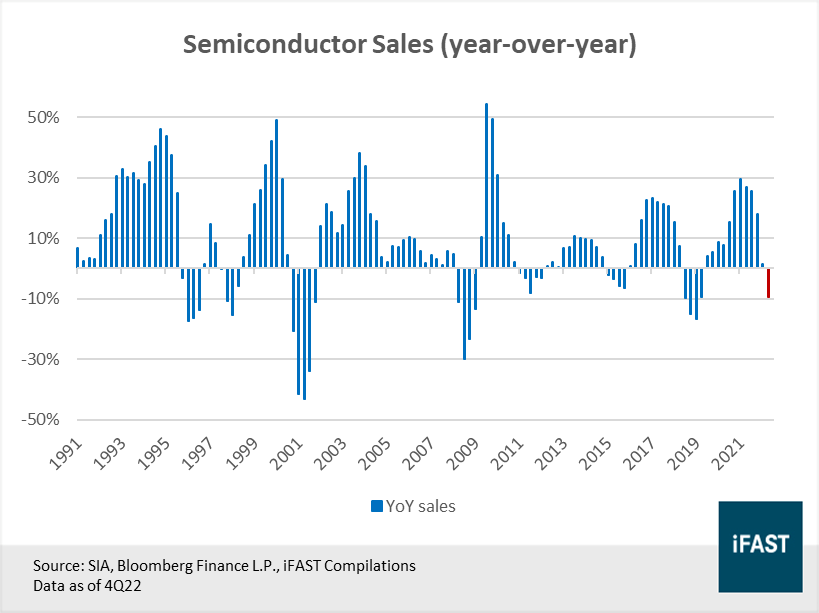
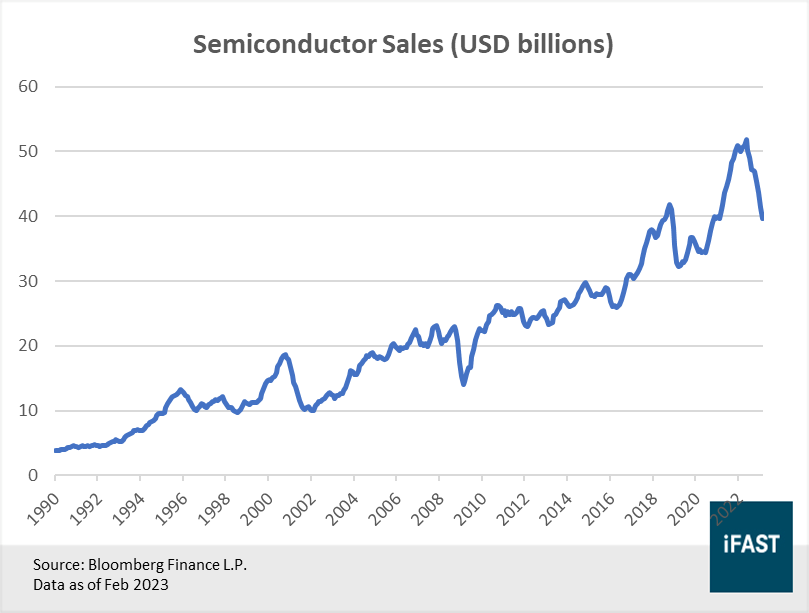
Most notably, semiconductor sales growth turned negative for the first time since 2019, falling by close to -10% in the fourth quarter of 2022 (Figure 2). If we look at things on a monthly basis, we can see that sales growth first turned negative in September, indicating that the down-cycle probably started way earlier. While the initial drop in sales was already significant, things will likely worsen over the coming quarters as the down-cycle plays out – which is bad news for semiconductor stocks. 


Figure 2: Semiconductor sales fell by nearly -10% in the fourth quarter of 2022


While there are a number of reasons that can explain why sales growth has been falling, most can be linked to imbalances in supply and demand. As most people were stuck at home during the early days of the pandemic, trends such as remote working were starting to gain traction resulting in heavy demand for consumer electronics. Many businesses also used the pandemic as an opportunity to digitalise their operations. The end result is an unusually high demand for chips, so much so that it caused a shortage. 

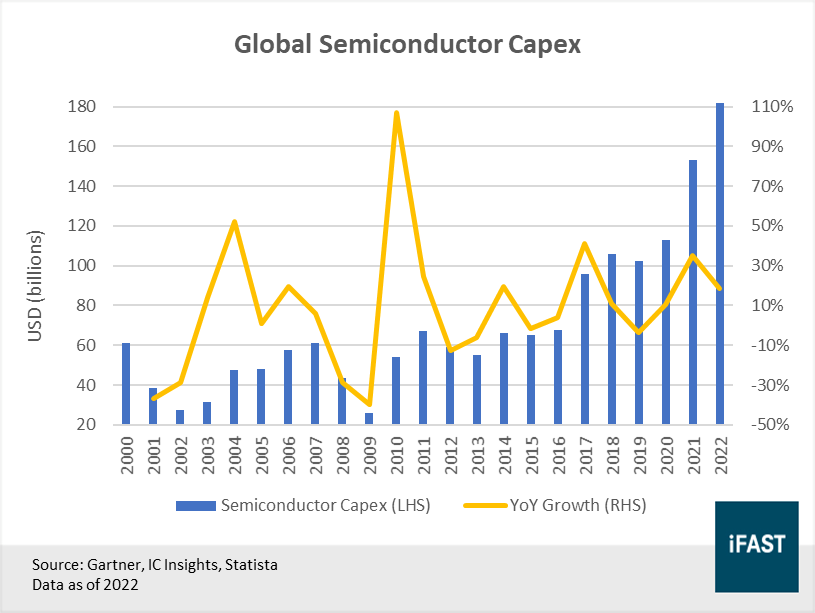
Facing pressure from governments and customers to alleviate the shortage, nearly all major chipmakers made commitments to expand capacity. As a matter of fact, the total industry capex grew by a staggering 26.7% CAGR in 2021 and 2022, significantly higher than the growth rate of 5.8% in the three years prior to the pandemic (Figure 3). Not surprisingly, this sudden and sharp increase in capex resulted in a supply glut. However, the timing could not be worse as this supply glut has come right when chip demand is dissipating rapidly, resulting in the down-cycle we are in today. 


Figure 3: Huge surge in capex across 2021 and 2022 has resulted in a supply glut


Short-term pain for chipmakers as inventory correction continues  

It is no secret that the economy today is on a much weaker footing compared to the beginning of 2022. Persistently high inflation, coupled with aggressive central bank policy, has slowed economic activity substantially, raising the risk of a recession. The recent collapses of Silicon Valley Bank and several other regional lenders are also evidence that tighter monetary policy is starting to bite, adding to concerns about the health of the economy. 

Thanks to the greater economic uncertainty, chip demand has fallen drastically. Trapped between high inflation and borrowing costs, consumers have been cutting back on spending. According to data published by IDC, shipments of consumer electronics, such as PCs, smartphones, and wearables have all declined in 1Q23.

Among the various players, Apple’s Mac shipments plunged by more than -40% (the worst among the lot) as consumers traded down for cheaper alternatives. With the pandemic boom behind us and a global recession looming, shipments of consumer electronics are likely to remain weak for the foreseeable future.

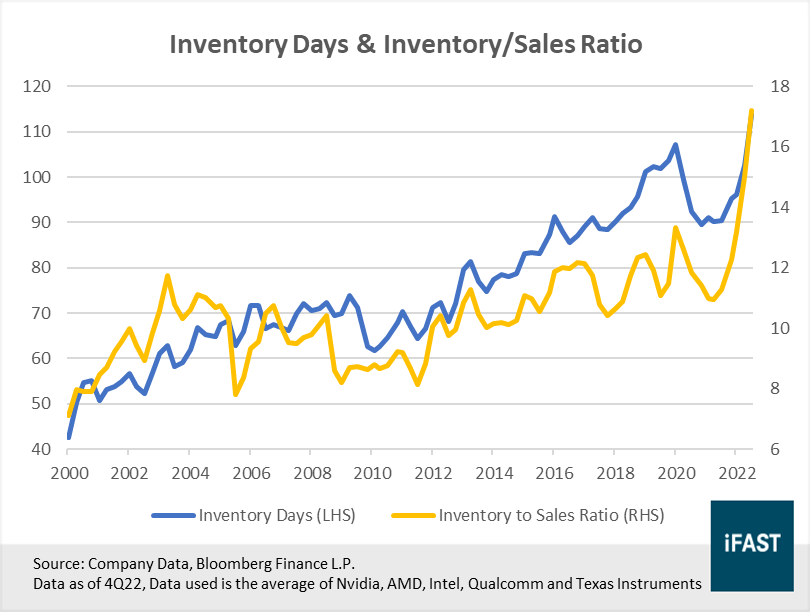
To make matters worse, inventory channels are bloated, likely because many customers double-ordered during the shortage. Taking a quick look at the numbers for the top five chipmakers in the US, we can see that inventory days (the average number of days a firm takes to sell off inventory) and inventory-to-sales ratio have both been rising. Both measures indicate that turnover has been slowing (Figure 4). 


Figure 4: Inventories have been rising among semiconductor companies as demand shrank


With demand falling and inventories rising, chipmakers will likely halt new orders and slash prices to get rid of excess inventory. Samsung said that it will meaningfully reduce production levels after a pileup in inventory and a collapse in memory chip prices caused the company to report the worst operating profit since the global financial crisis. 

TSMC is also bracing for weaker sales by cutting its capex spending. The company expects first quarter revenue to be about -15% lower and operating margins to fall by about -10%. According to the management, this inventory correction will likely last throughout the year and things should start to pick up in 2024. 


Related article: Running out of investment ideas? Here’s one that can bag you a 55% profit even in a recession


Down-cycles are temporary, long-term growth story remains intact 

The good news here is that down-cycles do not last forever. Despite the current downturn, we are confident that semiconductor sales will eventually recover to higher levels than before as it had done so every single time in the past. Therefore, it is not a question of whether or not a recovery will occur, but rather a question of when will the recovery take place. By our estimates, we think that the industry could return to double-digit growth as early as 2024. 


Figure 5: Semiconductor sales have always bounced back to higher levels than before post-downturn


According to estimates from McKinsey, the semiconductor industry is poised to become a trillion-dollar industry by 2030, which represents an annual growth rate of roughly 6-8%. Demand for chips is set to be driven by structural factors such as (i) an increase in the number of semiconductor applications, and (ii) the increase in silicon content in them.

These days, the use of semiconductors has become widespread. Recent innovations such as ChatGPT and the metaverse were only made possible because of advancements in semiconductor technology. Apart from this, the silicon content in most existing applications has also increased significantly over the years. 

Take cars for instance. Even though they were still largely mechanical since the start of the 21st century, thanks to new innovations such as autonomous driving, the silicon content of cars today is estimated to have grown by more than five times compared to a decade ago, and is still expected to grow even further. According to projections by Intel, semiconductors will make up more than 20% of a vehicle’s cost by 2026, a fourfold increase from 2019!  

The bottom line is this: as the world becomes increasingly tech-driven, chip demand will only become even stronger than before. This will bring immense benefits to the entire industry as a whole.


Downturns bring about the best buying opportunities

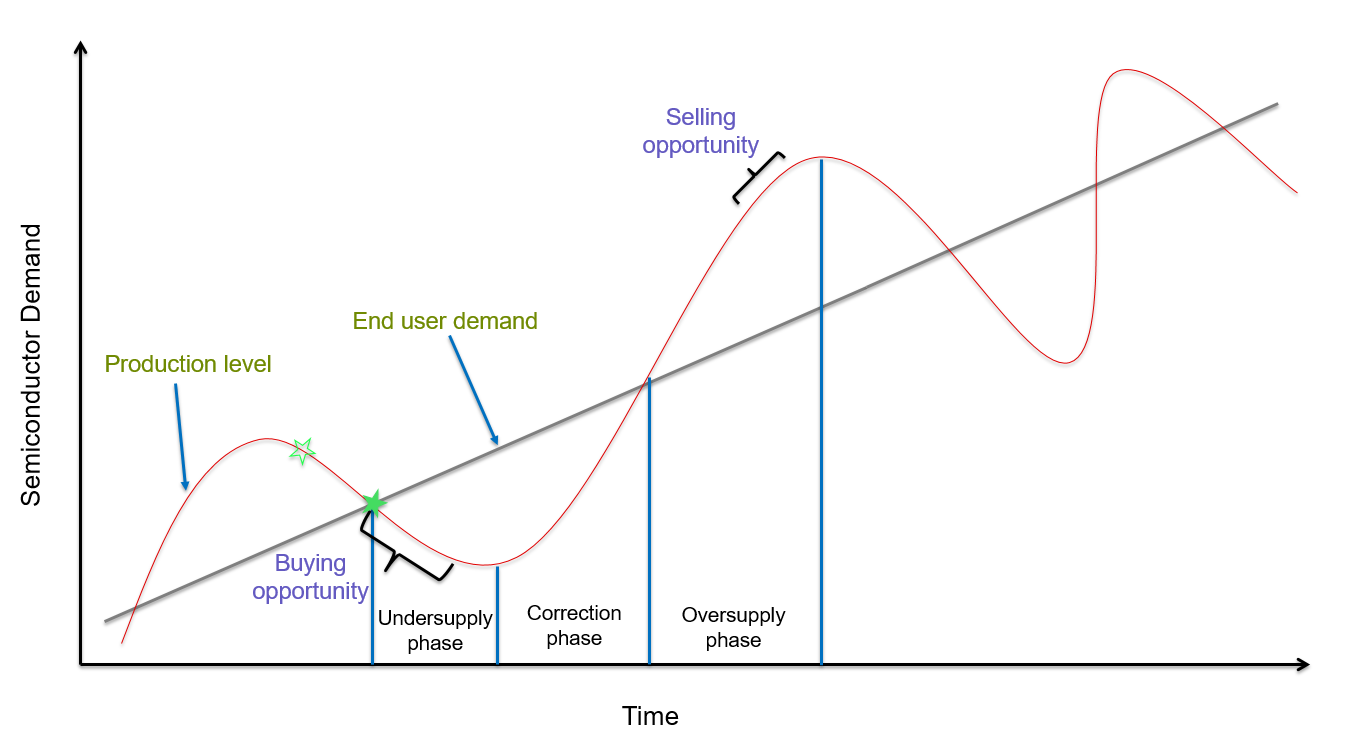
Down-cycles in the semiconductor industry come about once every few years. When they do, it is a buying opportunity not to be missed. While it is in our nature as investors to try and pick the exact bottom of the cycle, it is almost impossible to do so except in hindsight or with the help of sheer luck. Often, investors waiting to catch the cycle bottom end up missing out on the opportunity altogether. 

So instead of trying to pinpoint where the bottom is, what we can do is identify a range of buying opportunities in the cycle. In our opinion, the best time to start accumulating semiconductor stocks is during the start of down-cycles, when share prices are falling and manufacturers are cutting back on production (such as now). As scary as things may seem today, down-cycles can be a great opportunity to pick up shares at a discount.


Figure 6: Downturns bring about the best buying opportunities 

Source: iFAST


Even though valuations are not the cheapest at the moment and there is also the risk that share prices may tumble further, we believe that there is definitely long-term value within this industry. Stretching our investment horizon out further, valuations are not nearly as daunting as they are today – trading at just 15.8X 2025E EPS versus our fair PE multiple of 20X. This implies an upside of roughly 26%, and a target price of USD 317 for the VanEck Vectors Semiconductor ETF (NASDAQ:SMH).


Table 1: Valuations are not as daunting if investors think long-term 

MVSMHTR Index 

2022

2023E

2024E

2025E

Earnings Per Share (EPS)

282.86

212.15

254.57

318.22

Earnings Growth YoY

26.30%

-25.00%

20.00%

25.00%

PE Ratio (X)

14.40

23.73

19.78

15.82

Upside Potential

(based on fair PE Ratio of 20.0X)

-

-

-

26.40%

Source: Bloomberg Finance L.P., iFAST Compilations.

Data as of 20 Apr 2023


It is difficult to imagine a future without semiconductors. 

For an industry with such solid fundamentals, the growth prospects are simply immense. While we understand that conservative investors may want to wait for more clarity before buying in, longer-term investors can start building a position today using a regular savings plan, before switching to lump sum investments should valuations fall further.

Alternatively, investors may also consider single-stock names such as TSMC (NYSE:TSM), which trades at lower valuations relative to the broader US semiconductor industry. 


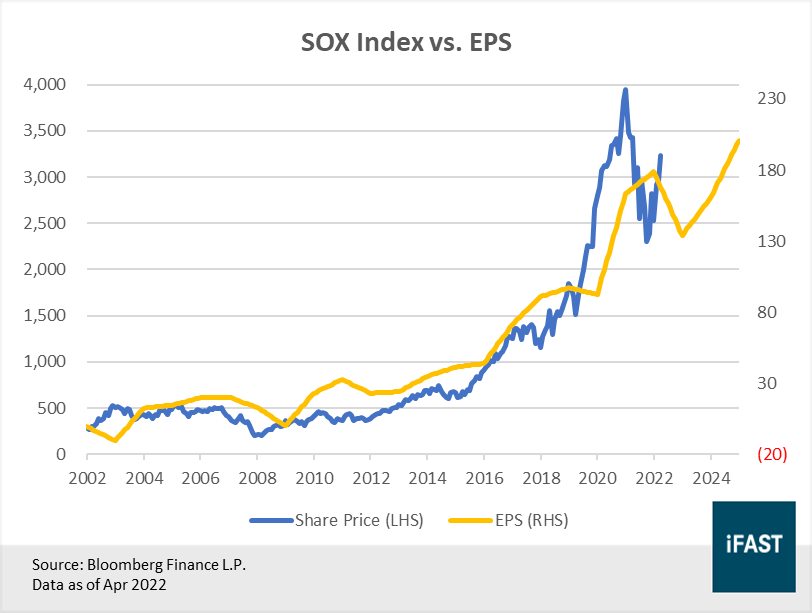
Figure 7: Share prices are driven by earnings in the long run

Saturday, March 25, 2023

Why The Federal Reserve “Playing Dumb” Is a Genius Move

 By now, you have probably read a lot of interesting interpretations of yesterday’s Federal Reserve meeting. It seems everyone in the financial world – and even outside of it – has an opinion about it and what it means for stocks. 


Arguably the most popular interpretation is that the Fed is making a policy mistake.

That is, the failures of Silicon Valley Bank and Signature Bank – as well as the near-failures of First Republic (FRC) and Credit Suisse (CS ), and all the volatility in the stock prices of pretty much every regional bank – underscore that we’re in the midst of a big credit crisis. 

Yet, while the Federal Reserve acknowledged that crisis yesterday, it still hiked interest rates. And Board Chair Jerome Powell sounded resolute in the Fed’s fight against inflation during the post-meeting press conference. 

Therefore, many interpreted this move as the Fed being tone-deaf to the credit crisis. And that makes them believe the central bank will hike the U.S. economy right into a recession. 

Those feelings were exacerbated when stocks, commodity prices, and Treasury yields all dropped yesterday. That’s a rare combination that typifies pre-recession behavior in the financial markets. 

But… 

What if this isn’t a policy mistake? What if the Fed knows exactly what it is doing here?

That’s my interpretation. 

I think the Fed is purposefully “playing dumb.” And I think it’s a genius move that will ultimately allow for the creation of a new bull market.

The Federal Reserve Made a Genius Move

Simply consider this: The Federal Reserve hasn’t ever discussed “tightening credit conditions” during this rate-hike cycle. Yet, yesterday, Powell mentioned it about a dozen times in the post-meeting press conference. He kept saying over and over again that because of the bank failures, credit conditions are tightening. 

Clearly, he wanted to emphasize to everyone that bank lending standards are tightening significantly. 

Still, he kept saying that it is too early to say what these tightening credit conditions will do to inflation. 

But anyone who has taken any economics class knows exactly what “tightening credit conditions” do to inflation: they kill it. 

Tighter credit conditions mean it is harder to get access to capital. The harder it is to get access to capital, the less capital consumers and businesses have at their disposal. The less capital they have at their disposal, the less they spend. The less they spend, the lower inflation goes. 

It’s not rocket science. It’s Economics 101. 

You really think the seven voting members of the Federal Reserve don’t know this? You really think that a bunch of folks who are supposed to be the best economic minds in our country don’t know that big bank failures create significantly tighter credit conditions and kill inflation? 

They know it. 

But they can’t say it.

Getting the Best of Both Worlds

By enacting a policy of deliberate ambiguity, the Fed will get the best of both worlds. 

We won’t get re-inflation because markets won’t run away with this idea that the “coast is clear.” Bloomberg’s Commodity Index dropped again yesterday and remains at its lowest level since Russia invaded Ukraine. And real-time inflation data from Truflation, which measures millions of data points and contrasts outdated government metrics, shows that inflation is collapsing toward 4% right now. 

We also won’t get an economic collapse because the banks – or their depositors – won’t be overly fearful that the Fed is staying aggressive with rate hikes. 

Instead, we will get rapid disinflation without a recession – which, perhaps uncoincidentally, is exactly what we’ve had over the past nine months. 

Inflation peaked in June 2022. Since then, it has dropped more than 300 basis points. As it has, the unemployment rate has barely budged, and the economy has continued to expand. 

What other Fed in history has cut inflation by 300 basis points without hurting the labor market? 

Give this Fed credit. It knows what it’s doing. 

It’s done an awesome job so far, and it’s about to finish things up with a masterful final act by executing a policy of deliberate ambiguity until inflation collapses over the next few weeks. Then it’ll pivot fully dovish in May, pause rate hikes, and fully support the economy… and markets. 

Long story short, this is a great buying opportunity.

The Fed’s fight with inflation is nearly over, and it’s figured out a way to finish this fight without knocking out the U.S. economy. Within months, inflation will be dead, the Fed will be on pause, the economy will be recovering, and stocks will be rebounding with vigor.

We believe this is the ninth inning of the bear market. Up next is the first inning of a prolonged, multi-year economic expansion and bull market. 

This is buying time. 

If you agree, find out what stocks you should be buying to prepare for this emerging bull market.


(Luke Lango)

Monday, March 20, 2023

Michael Burry Calls a Stock Market “Bottom” – Is He Right?

If there is one person you, me, and every investor should listen to during a bear market, it is Michael Burry.  You may know him from the movie based on his life, The Big Short, but he is the esteemed hedge fund manager who correctly predicted the subprime mortgage market meltdown in 2008. 


He’s a certified bear market genius. No one knows how to navigate turbulent markets better than him. And he just issued a shocking warning to his 1.4 million Twitter followers about the current bear market – a warning that you may miss out on a monster rally of epic proportions over the next six months if you don’t buy stocks today!

That’s right. The bear market genius, Burry himself, is suddenly sounding bullish. 

So, what exactly did Burry say? How is it bullish for stocks? And is he right?

Let’s take a deeper look.

The Tweet

Yesterday, Michael Burry sent the following tweet. In true Burry fashion, he has since deleted the tweet (for those who don’t know, he deletes all his tweets after about a day). But many stock market observers screenshotted the tweet because it is of paramount importance. A screenshot is posted below. 

U.S. E- Commerce Sales. A chart showing revenue since 1999 shows upward growth in billions.

In short, Michael Burry is drawing parallels between the recent string of bank failures – Silicon Valley BankSignature Bank (SBNY), and now possibly First Republic (FRC) and even Credit Suisse (CS) – to the so-called “1907 Bankers’ Panic.” 

In that bank panic, a multitude of market and economic factors sparked a bank run on Knickerbocker Trust, one of New York City’s largest banks at the time. The country was spooked. Suddenly, everyone started withdrawing their money from banks, and there was a massive credit crunch, also known as a bank run. Faith in America’s banking system was breaking. 

In response, the stock market crashed. The Dow Jones dropped almost 50% in a hurry.

JPMorgan to the Rescue

Then, JPMorgan stepped in and saved the day. He pledged a chunk of his fortune to help shore up the banking system. He also convinced a bunch of other wealthy financiers at the time to do the same. 

Collectively, they saved the U.S. banking system from collapse, restored consumer confidence, and stabilized financial markets. 

Within weeks of JPMorgan pledging his capital, the stock market’s 50% “flash crash” ended, and stocks soared. 

U.S. E- Commerce Sales. A chart showing revenue since 1999 shows upward growth in billions.

Mr. Burry thinks history is repeating right before our very eyes. 

That is, the Bank Panic of 1907 ended when a stand was made to protect and shore up failing banks. 

This past weekend, a similar stand was made by the U.S. government to protect and shore up failing banks Signature Bank and Silicon Valley Bank. 

Then, just yesterday, another similar stand was made by the Swiss government to protect and shore up Credit Suisse. 

The “stands are being made” all around us, so to speak. 

Burry seems to think that these stands are a prelude to significant market bottoms – and huge stock market rallies 

After all, after the stock market bottomed in the Bank Panic of 1907 following a stand being made by JPMorgan, the market basically doubled over the next two years. 

Could we be in store for a similar huge rebound rally over the next two years?

Burry’s cryptic tweets seem to suggest he thinks it’s entirely possible.

We believe a major stock market bottom was put in place late last year, and that right now, we are in the first innings of a new bull market breakout. 

Recent developments in the banking sector – alongside the swift and strong response from major governments across the globe – have strengthened our bullish conviction. 

This  feels like when JPMorgan rescued the banks in 1907. It feels like when the government rescued the financial sector in 1998, and when it rescued it again in 2008. This feels like when the government rescued the economy in early 2020 as the COVID-19  pandemic hit. 

When the government starts rescuing things, stocks start soaring.

The government started rescuing things this past weekend. Now, it’s time for stocks to start soaring – which they're doing today. 

(Luke Lango)