Wednesday, January 31, 2024

SoFi Reports Astonishing Earnings, and the Best Is Yet to Come

 The fourth-quarter earnings season is now in full swing. And so far, the numbers show that it’s been quite a strong quarter for many companies. But perhaps one of the strongest performances we’ve seen so far comes from one of our favorite long-term investments. Of course, I’m talking about fintech superstar SoFi (SOFI).


Now, I have to say that this Q4 earnings report was fantastic across the board. But one of the most exciting things to note here is that SoFi has achieved profitability for the first time since its initial public offering in 2021.

The fintech superstar reported $48 million of net income in Q4, far surpassing analysts’ average estimate of $9.9 million. And with adjusted net revenue clocking in at $594.2 million, SoFi beat those average estimates by more than $20 million.

Not to mention, the firm reported $18.6 billion in total deposits for this past quarter, up from $7.34 billion in 2023. We’re talking about a 150%-plus increase in total deposits year-over-year.

All this has gotten investors head-over-heels for the fintech darling. And since it reported quarterly results, SoFi stock has rocketed nearly 20%!

We think this party is probably just getting started.

That’s because, phenomenal earnings aside, SoFi has the fundamental backbone it needs to take over the fintech world. And that means it has great potential to make investors quite a pretty penny.

We honestly believe investors who buy and hold enough SoFi stock today could turn into millionaires over the next few years.

Here’s the complete story.

Banks Suck, But SoFi Solves the Problem

Hardly anyone likes the legacy banking process.

Think about account fees, clearinghouses, high interest rates, broken digital experiences, confusing rewards programs, long phone calls and in-person appointments. The entire process is slowexpensive and cumbersome. And that’s mostly because the industry is full of profit-taking middlemen. It’s rooted in antiquated and costly physically native processes.

So… what if technology bypassed those middlemen profiteers? What if someone created a digital bank with technology-driven processes that delivered fast, cheap, and convenient solutions to customers everywhere?

That’s what SoFi is doing.

SoFi was founded in 2011 by Stanford business school students fed up with the inefficiencies of the student loan industry. They saw a huge opportunity to fix those inadequacies, which they recognized were rooted in two things.

One – at the time, banking was a physical-first industry. And therefore, it was weighed down by property-related expenses that were inevitably passed onto the consumer.

Two – student loans were typically structured as complex transactions with tons of middlemen. And all had their own fee that the college student had to pay.

So, SoFi was created on the idea of leveraging automated technologies to create hyper-convenient access to cheap student loan refinancing.

And it worked.

Over the past decade, students across America have flocked to SoFi to refinance their loans, taking advantage of its lower rates. Those rates have been achieved using technologies to reduce the operating costs of the business. And SoFi has, of course, passed those cost-savings onto students.

That was the “hero product” that put SoFi on the map in the fintech world.

SoFi has since leveraged this success story to build an ecosystem of high-quality, low-cost, and hyper-convenient fintech solutions. And all are accessible through its single, intuitive “super app.”

The SoFi Super App

Through the SoFi app, the company offers:

  • SoFi Money: a cash management account that acts like a mobile checking or savings account. It has no account fees, 1% APY and an attached debit card.
  • SoFi Invest: an attached mobile investing account. In it, consumers can use their funds from SoFi Money to invest in stocks, ETFs and cryptocurrencies. They can also invest in pre-IPO shares, which are usually reserved for institutional clients.
  • SoFi Credit Card: an attached credit card. Consumers can link their Money accounts to this card and earn 2% cash-back on all purchases. Those rewards can be used to pay down debt through a SoFi loan or invest in stocks/cryptos with SoFi Invest. And there’s no annual fee.
  • SoFi Relay: an attached budgeting software tool. Consumers can use it to track and monitor spending via SoFi accounts and external linked bank accounts. They can also check their credit score.
  • SoFi Education: complementary educational articles and videos that help consumers learn everything about finance. It covers topics from how to invest in cryptos, to what an APR is, to why credit scores matter.

With the SoFi app, you get all those things… in one application. It’s an all-in-one mobile money app that’s leveraging technology to make banking fastcheap and easy.

It’s the future – which is why we see this stock as such a winning bet.

Why SoFi Will Win the Digital Finance War

Now, to be sure, SoFi is not alone in its pursuit to reinvent the consumer finance experience. Entrepreneurs and venture capitalists have long realized that consumer banking sucks and needs to be digitized to be improved. To that end, there are lots of digital finance apps out there attempting to be the “Amazon of Finance.”

But in this digital finance war, SoFi stands superior with clear competitive advantages to sustain its leadership.

Most other apps in this space are barely breaking a few hundred thousand users (if that) with tiny revenue streams. That’s not true for SoFi.

SoFi has more than 7.5 million members on its platform. And it’s been growing that number by 500,000-plus new members every single quarter (44%-plus year-over-year growth).

U.S. E- Commerce Sales. A chart showing revenue since 1999 shows upward growth in billions.

Currently, SoFi is the unrivaled leader in the digital finance war.

And we don’t think this will change anytime soon. It seems SoFi has durable competitive advantage, which should allow it to turn into the “Amazon of Finance.”

The Team

First, there’s the team. Great people make great products. If there are great people on your team, your company will likely make great products that consumers consistently return to.

SoFi has the best team in all of finance. The CEO was CFO at Twitter (TWTR). Before that, he was the head of global banking at Goldman Sachs (GS). And that’s a position he held after being CFO of the NFL. He’s an impressive person, to say the least.

SoFi’s CFO is a former Uber (UBER) finance executive. Its CMO used to head up global corporate marketing at Intuit (INTU ). SoFi’s president was formerly the president of USAA Bank. The chief risk office held the same position at Citibank (C). And the product head used to be the VP of Amazon’s Alexa shopping group.

SoFi’s employee base includes former Wells Fargo, Goldman Sachs, Citi, JPMorgan (JPM) and Bank of America bankers and analysts. Another 160-plus employees hail from Amazon, Apple (AAPL), Microsof(MSFT), Alphabet (GOOG), Met(META) and Netflix (NFLX ).

This is the dream team. If any collection of folks can figure out how to create the “Amazon of Finance,” it’s this group.

Network Effects

Second, you have network effectsSoFi benefits from viral network effects both for in-app engagement and new-user acquisition.

In terms of in-app engagement, SoFi has successfully created a growth flywheel. Consumers join SoFi for one of its products and, over time, are attracted to and eventually adopt multiple products. This growth flywheel promotes durable average-revenue-per-user growth.

And with respect to user acquisition, SoFi is such a loved product that consumers rave about it to their friends. Through this word-of-mouth recommendation loop, SoFi has been able to grow like wildfire with minimal marketing costs. Case-in-point: I was the first to adopt SoFi in my social circle. I raved about it. Most of my friends tried it. And now it’s the most used personal finance app in my crowd.

That dynamic is playing out everywhere, every day. It creates a pathway for durable user growth.

Durable user growth combined with durable average-revenue-per-user growth, on top of a talented team that will only make this product better over time, means that SoFi realistically projects as the bank of the future.

And if that happens, SoFi stock will rattle off some enormous gains from current levels.


The Math to Fat Gains in SoFi Stock

By our numbers, SoFi stock has a realistic pathway to 21X your money – if you buy today!

According to the U.S. Census Bureau’s 2023 population estimates, the U.S. population currently measures around 335 million people. As of 2020, the total population of folks 18 and older measured 78%. We believe about 20% of those people could be SoFi members by 2030, which would imply a member base of ~52 million people.

We also think most users will employ about three products (Money, Credit Card and Invest), implying around 156 million total products used. And we estimate that average revenue per product at that time will be about $200. Assuming so, that puts 2030 revenue at over $31 billion.

And according to its recent earnings results, SoFi has achieved 30% EBITDA margins. Assuming that remains true, we believe net profits could eclipse $9.3 billion by 2030.

Based on a simple 20X price-to-earnings multiple, that implies a 2030 valuation target for SoFi of over $186 billion. That’s up around 21X from today’s $8.7 billion market cap.

So, if SoFi does indeed turn into the “Amazon of Finance,” we think its stock has 21X upside potential from current levels.

And per our analysis of the products and the team, we think SoFi stands a great chance at success.

So… what’re you waiting for? Pile into SoFi stock before it reaches outer space.

The Final Word

As the saying goes, where there’s disruption, there’s opportunity. And when it comes to the fintech industry, no one’s shaking things up like SoFi.

That means this superstar holds some major potential. So, if you’re a long-term investor hoping to mint serious wealth, you may not find a better opportunity than SOFI.

Though, fintech isn’t the only sector experiencing a seismic shift.

Thanks to the emergence of next-gen AI technology, we’ve entered a new era of investment: the AI Boom. And over the past year, as artificial intelligence has progressed at a rapid pace, all-things AI have exploded in popularity: including top AI stocks.

We’re confident this new AI-driven bull market will persist throughout the rest of the decade. But certain stocks will rocket much more furiously than others.

(Luke Lango)

Verdict: Sofi could contribute to my retirement in a big way. But it is a wild card, and I will only buy small amounts. I will buy for keeps till the end of this bull market, anticipated to be end 2025.


Tuesday, January 30, 2024

A Major Divergence Suggests Small Caps Could Really Pop

 Something very odd is happening between large and small caps in the stock market right now. And we believe it’s creating one of the best investment opportunities of the past 40 years. 


But time is of the essence here. 

You’ve probably heard by now that the large-cap S&P 500 has surged to all-time highs. In fact, as of this writing, it’s actually up more than 2% from its previous record highs in early 2022. 

But meanwhile, the small-cap Russell 2000  is basically still stuck in a bear market. As of Friday, Jan. 26, it was still down more than 20% from its record highs in late 2021. 

In other words, large caps are soaring to record highs while small caps are floundering. 

This has never happened before. 

In all of the stock market’s history, the S&P 500 has never been at all-time highs while the Russell 2000 was still in a bear market. 

However, we have seen similar situations play out before. And if stocks behave the way history suggests, prudent investors could bank some hefty profits.

Small Caps Will Snap Back

Three times in the past, the S&P 500 was at all-time highs while the Russell 2000 was in correction territory (down more than 10% from all-time highs). 

And all three times, small caps rallied furiously over the next year. 

Back in early 1985, the S&P 500 pushed to all-time highs while the Russell 2000 was still down 13% from its previous highs. Over the next year, the Russell 2000 rallied almost 20%. 

In early 1991, the S&P 500 pushed to all-time highs while the Russell 2000 was still down 14% from its previous highs. Over the next year, the Russell 2000 rallied as much as 36%.

Then in 1999 – the best analog to today’s situation, in our opinion – the S&P 500 pushed to all-time highs while the Russell 2000 was down 19% from its previous highs. And over the next year, the Russell 2000 rallied as much as 50%.

In other words, every time the S&P 500 has pushed to all-time highs while the Russell 2000 was still down big, small caps soared over the next year in a furious “snapback” rally. 

The bigger the divergence between the S&P 500 and Russell 2000, the bigger the snapback rally.

The Final Word

In 1985, the Russell 2000 was down 13%. It popped nearly 20% over the next year. 

In 1991, it was down 14% before it went on to pop almost 40% over the next year. 

And in 1999, it was down 19%, then soared more than 50% over the next year. 

Right now, we’re staring at these indices’ biggest divergence in history. 

The evidence suggests that means we’re also potentially staring at the biggest small-cap “snapback” rally of all time. 

(adapted from Luke Lango)


Saturday, January 13, 2024

It Is Time to Buy Crypto Stocks for the Fourth Halving Boom in 2024

 About once every four years, Bitcoin (BTC-USD) undergoes a “halving” event, where the supply of new Bitcoin is essentially cut in half.


Bitcoin miners are rewarded with new bitcoins for validating transactions and adding them to the blockchain. During a halving event, the reward miners receive for mining new blocks is halved. For example, if miners were receiving 12.5 bitcoins per block before the halving, they would receive 6.25 bitcoins per block afterward.

The purpose of halving is to control the supply of new bitcoins entering the market. Bitcoin’s total supply is capped at 21 million coins, and halvings ensure that the total supply is released gradually over time, rather than all at once, similar to the mining of precious metals like gold.

Bitcoin halvings are designed into the cryptocurrency’s protocol; they are part of its DNA, set to occur after every 210,000 blocks are mined, which translates to roughly every four years.

We’ve experienced three Bitcoin halvings since the inception of cryptocurrencies. The fourth is scheduled for April 2024.

This is extremely bullish for cryptocurrencies because historically, halving events have sparked “boom cycles” in the crypto market.

Theoretically, the reduced supply of new bitcoins can lead to an increase in demand, which should drive up the price.

In practice, this has been the case.

Bitcoin typically enters a boom cycle in the 24 months surrounding a halving event, soaring in the 12 months before and after the event.

The first halving occurred in November 2012. Between November 2011 and November 2013, Bitcoin’s price increased from $2.50 to $1,000.

The second halving was in July 2016. From July 2015 to July 2017, Bitcoin’s price rose from $270 to $2,500.

The third halving occurred in May 2020. From May 2019 to May 2021, Bitcoin’s price jumped from $7,000 to $60,000.

The fourth halving is set for April 2024.

The Fourth Boom Cycle Has Already Begun

Over the past 12 months, Bitcoin has soared from $17,000 to $44,000.

If the pattern holds – and all evidence suggests it will – then Bitcoin should soar to above $100,000 by late 2024 or early 2025.

Of course, that means it’s time to buy crypto stocks.

Bitcoin performed well in the last halving boom cycle, but crypto stocks did even better, especially in the second half of the boom cycle, or the 12 months following the third halving.

From May 2020 to May 2021, Bitcoin rose 560%. However, crypto miner Bitfarms (BITF) saw its stock soar nearly 1,400%, more than doubling Bitcoin’s return.

Another crypto stock, Riot Platforms (RIOT), rose more than 3,800% over the same period, while Marathon Digital (MARA) skyrocketed almost 8,300%.

That means Marathon Digital – a crypto stock – outperformed Bitcoin by nearly 15X in the last halving boom cycle.

Buying Bitcoin to prepare for this Fourth Boom Cycle coming in 2024 is a fine strategy.

But it isn’t the best strategy.

The best strategy is to buy the top crypto stocks.

That’s exactly what we plan to do in January.

We think it’s unwise to rush out and buy crypto stocks right now. They’re too hot and will likely cool off.

We expect a decent pullback in the crypto market in early 2024. On that pullback, we’re going to embark on our first crypto stock buying spree since 2020.


Wednesday, December 20, 2023

Pullback and then rally

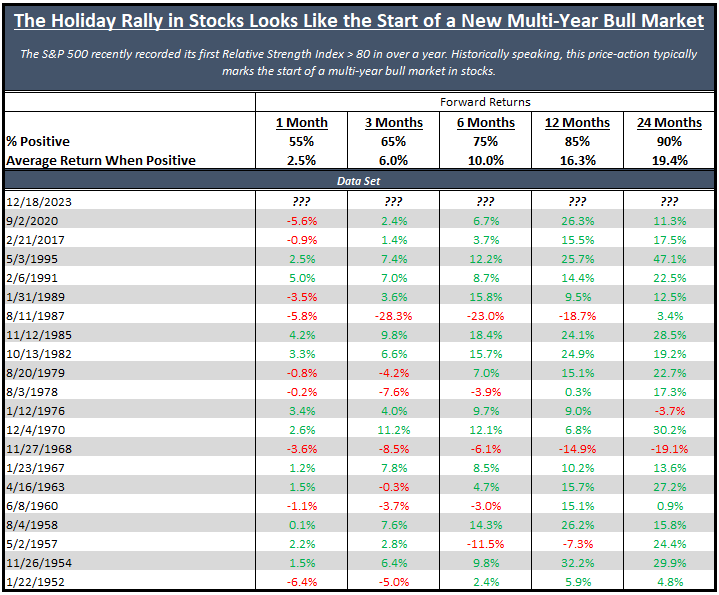
 In the 12 months after they become extremely overbought for the first time in a year, stocks rally 85% of the time. And in the following 24 months, they rally 90% of the time. Average returns in the following one- and two-year periods are 16% and 19%, respectively.

U.S. E- Commerce Sales. A chart showing revenue since 1999 shows upward growth in billions.

In other words, after the market becomes this overbought for the first time in a year, stocks tend to pull back over the next month – then soar over the next 12 and 24 months. 

That’s the pattern that was signaled yesterday. 

And that means stocks will likely fall in January – before they absolutely soar throughout the rest of 2024. 

You need to buy that dip. 


Adapted: Luke Lango 20 Dec 2023

Friday, October 20, 2023

Global Semiconductors: Place Your Chips to Ride on Recovery Wave (adapted from DBS)

 Green shoots are starting to emerge in the end markets

Chief Investment Office27 Sep 2023
  • Global semiconductors shipments to experience further upside ahead
  • Boom in AI driving demand for memory chips used by servers and data centres
  • Green shoots appearing in end markets - bottoming PC shipments and improving mobile shipments
  • Easing concerns on Tech's valuation premium amid recent upward earnings revision
  • Preference for upstream companies offering stable mid-to long-term growth drivers
Photo credit: iStock

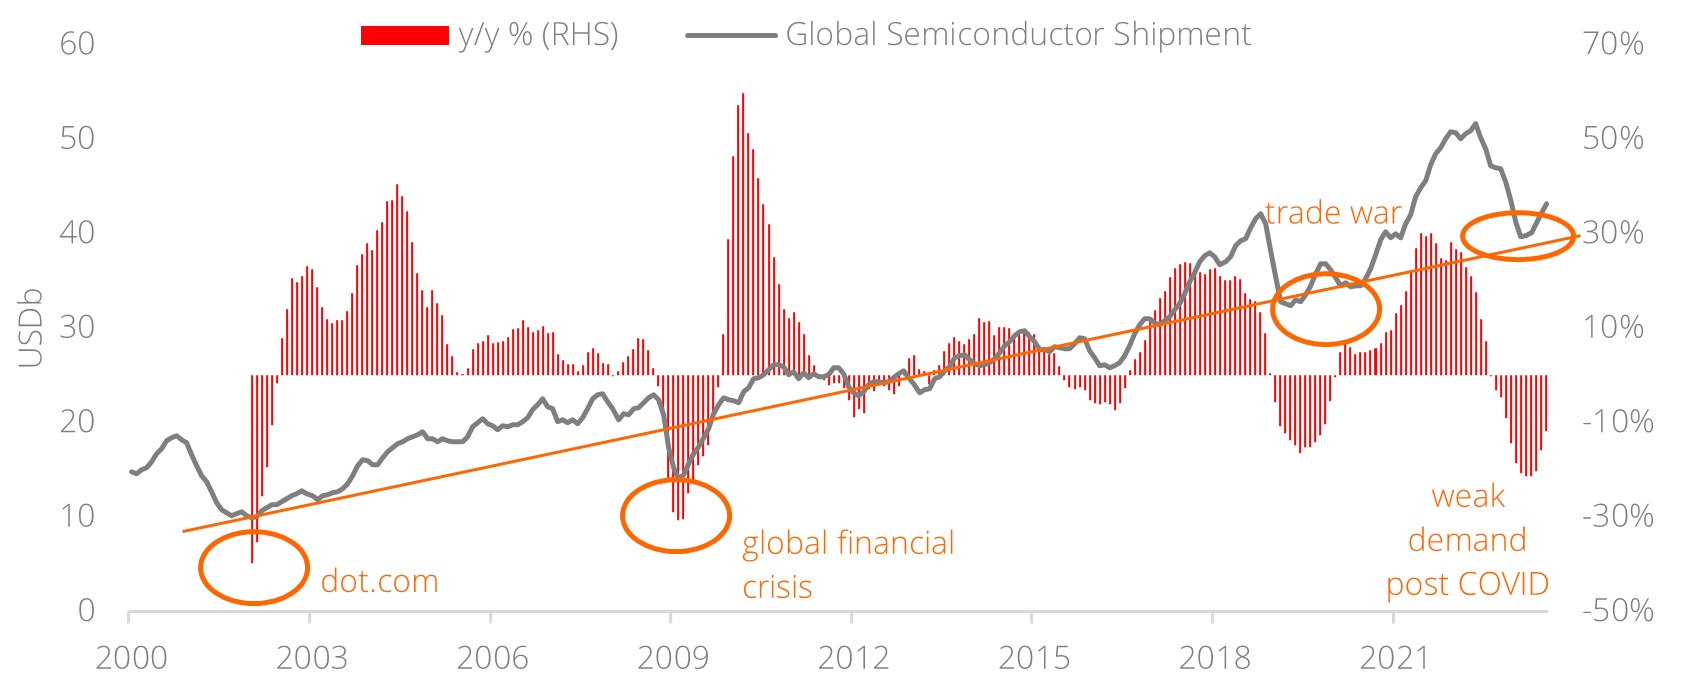
Global semiconductors industry on a recovery path. Global semiconductors shipment is on the rise and the drivers are:

  1. Bottoming of demand for memory chips: Demand for memory chips (previously the worst-hit) has bottomed and this segment is expected to lead the rebound for the semiconductors industry going forward. Artificial intelligence (AI) boom is driving demand for memory chips used by servers and data centres which require a large amount of memory capacity. For instance, an AI server possesses 6-8 times DRAM content as well as 3 times NAND content of a regular server.
  2. Positive flywheel effect through AI: The AI semiconductor segment is projected to grow at a CAGR of 22% in 2022-2027 (vs. 4.6% for the broader market). Apart from data centres, the other beneficiaries of AI include equipment makers and memory chip manufacturers. Every 1% increase in AI server penetration in data centres is expected to translate to USD1-1.5b of wafer fab equipment investment.
  3. Inventory destocking: Inventory destocking is on track and the process is expected to bring inventories back to normalised levels by 4Q23.

Green shoots sprouting for end markets; Improvement in macro outlook. Green shoots are starting to emerge in the end markets and they are: (a) 2Q23 saw sequential rebound in PC shipments (at +7.9% q/q) and this points to a bottoming of the PC market, (b) The decline in shipments for the mobile segment has narrowed compared to previous quarters, and (c) The server segment is seeing higher-than-usual GPU server shipments.

On the macro front, meanwhile, the outlook for electronics exports (in particular, for Singapore and Taiwan) is improving as well.

Preference for upstream semiconductors companies offering sustainable mid- to long-term growth. Prevailing market concerns on Tech’s valuation premium have eased amid recent upward earnings revisions, in particular for index heavyweights like Nvidia. This is a positive development given the tendency for valuation to either trade near or exceed its previous peak. Indeed, the sub-segments that registered sharp valuation expansion since the trade war include equipment makers, IDMs (integrated device manufacturers), and foundries.

On balance, we have a preference for upstream semiconductors companies offering stable mid- to long-term growth drivers.

Figure 1: Global semiconductor shipments bottoming


Source: Semiconductor Industry Association, CEIC, DBS

Thursday, October 5, 2023

The Technicals Say It's Time to Buy This Stock Dip


Since late July, the stock market has been in free fall, dropping as much as 8% in what matches its biggest correction of the year. 

But yesterday, some major technical signals were triggered. And they collectively suggest that stocks have hit a bottom – and that it is time to start aggressively buying this stock dip.

Analyzing This Stock Dip & Its Bullish Technical Setup

For starters, the S&P 500 is now closing in on its 200-day moving average. Last night, the index closed at 4230. And its 200-day moving average sits just above 4200. 

Back in March of this year, the S&P 500 commandingly retook its 200-day moving average. And this is the first time since then that the market has fallen back to the 200-day. 

That’s a bullish technical setup. 

Typically, the 200-day moving average serves as a very solid line of defense during selloffs. That is, stock market corrections tend to bottom at the 200-day moving average. Therefore, this one should prove no different.

Meanwhile, the S&P 500 has also dropped to its major “new bull market” support line. 

Following 2022’s nasty bear market, the market then finally bottomed in October of last year. And since then, stocks have surged higher in a very clearly defined uptrend channel. With yesterday’s selloff, the S&P 500 has dropped to the bottom-side of this channel. 

The last time the market dropped to the bottom-side of this channel? Back in March 2023 – right as the February stock market selloff was ending and right before stocks surged higher from April to July. 

That suggests that stocks should bounce here.

Wednesday, September 27, 2023

The S&P is poised to test two big technical levels … the Toxic Trifecta continues pummeling the market

The S&P faces two major tests that will make or break its short-term direction.

The first is its multi-month trendline.

As you can see below, the S&P is about to test the backbone of this year’s bull market.

Chart

This long-term trendline falls at roughly 4,260. With the S&P trading at 4,288 as I write Tuesday morning, we’re less than a percent higher.

If the S&P loses this support line, the trend break would suggest more weakness to come.

However, if we bounce, it would be a significant sign of strength. We’d likely see some emboldened bulls jump back into the market in expectation of a budding relief rally.

The second test would occur if the S&P fails the first test

In that case, we’d be looking to see if the S&P can find support at its long-term 200-day moving average (MA).

To make sure we’re all on the same page, a 200-day MA is a line on a chart showing the average of the prior 200 days’ worth of asset prices. It’s an important psychological line-in-the-sand for investors and traders.

When the asset’s price is above the 200-day MA, many traders interpret it as a sign that sentiment is bullish. The bearish opposite is true when asset prices are below this level.

Since many trading algorithms base their buy-and-sell decisions on the interplay between an asset’s price and its 200-day moving average, this is an important long-term technical level.

As you can see below, the S&P is barely 2% above this important 200-day MA.

Chart

If we lose this support level, we’re likely in for an acceleration of losses as risk-off sentiment spreads among traders.

Holding it and bouncing would open the door to renewed bullishness.


As to which way the market will break, keep your eye on the Toxic Trifecta

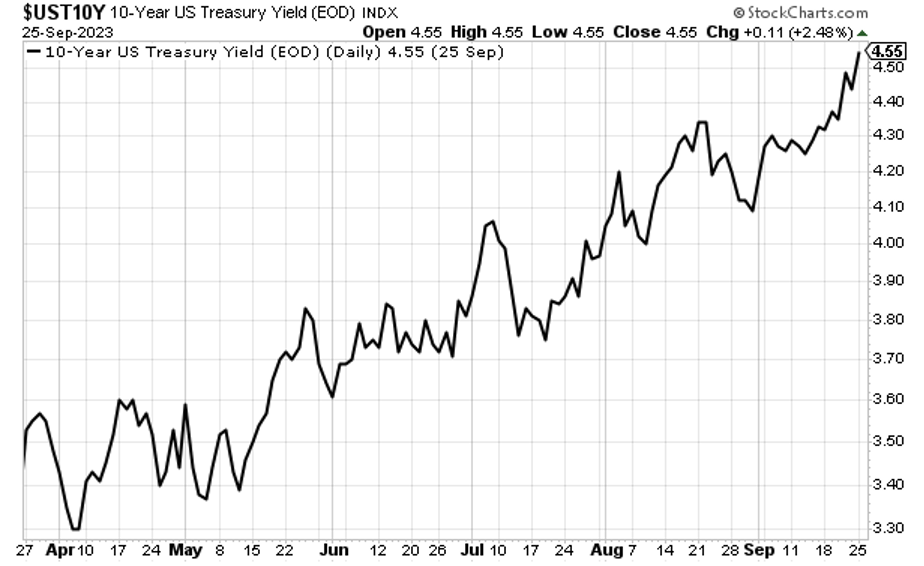
Here in the Digest, the “Toxic Trifecta” is the name we’ve given to the combination of the surging 10-year Treasury yield, the soaring cost of oil, and the climbing U.S. Dollar Index.

Today, we’re not seeing any meaningful relief from this damaging threesome.

As you can see below, the 10-year Treasury yield has been exploding, coming in at nearly 4.52% as I write. Back in April, it was as low as 3.25%.

(The chart below shows yesterday’s closing price.)

Chart

Over in the oil patch, though the price of West Texas Intermediate Crude is off its recent high of roughly $93, it remains at $89.

That’s plenty high to inflict pain on business operating costs and family budgets.

Chart

Finally, the U.S. Dollar Index continues climbing.

For newer Digest readers, the dollar index is a measure of the value of the U.S. dollar relative to the value of a basket of six major global currencies – the euro, Swiss franc, Japanese yen, Canadian dollar, British pound, and Swedish krona.

It’s now above $106, the highest level in six months.

Chart

Until we see a pullback in this Toxic Trifecta, the market will struggle to return to bullishness.

Luke Lango is laying the market’s recent underwhelming performance at the foot of the Fed

Luke is our hypergrowth expert and the analyst behind Innovation Investor. While most analysts were caught off guard by this year’s gains, Luke has been a roaring bull since late 2022. But in the wake of last week’s Federal Reserve meeting and Chairman Powell’s comments, he’s modifying his forecast.

Luke’s broad takeaway is that “until the Fed breaks from [it’s “higher for longer”] messaging, stocks will remain sluggish.”

Let’s jump to his Daily Notes in Innovation Investor for more:

Due to the Federal Reserve’s actions, it is our belief that the new trajectory for the stock market is cause for an update of our investment strategy. 

In short, before the Fed’s hawkish commentary [last week], we were near-, medium-, and long-term bullish. We were bullish all around.

Now, after that hawkishness, we are short-term bearish but still medium- and long-term bullish.

Practically speaking, this means Luke isn’t recommending a “buy the dip” approach in the next handful of weeks. Instead, it’s a slightly tweaked approach: “Wait for the right moment to buy the dip aggressively.”

Luke and his team are monitoring the technical and fundamental trends underlying the stock market right now with the goal of identifying that “right moment.”

Here’s Luke:

…When it appears, we’ll let you know immediately – and go on a huge shopping spree. 

Because a golden buying opportunity is coming.

How high is the market headed once bullishness eventually returns?

In answering this, Luke points toward earnings estimates and historical price-to-earnings ratios.

Back to Luke’s Daily Notes:

Earnings growth is expected to inflect from negative this year to positive next year and stay positive in 2025. That’s bullish. 

If you run the math on those future earnings estimates, it becomes clear that – so long as those estimates prove true – stocks will soar over the next 15 months. 

The 2025 EPS estimate for the S&P 500 is $290. The S&P 500 has averaged a forward earnings multiple of 17.5X over the past 15 years, and 20X over the past five years. 

At the lower end, a 17.5X forward multiple on 2025 EPS estimates of $290 implies a 2024 price target for the market of 5,075 – about 16% above where we currently trade. 

At the upper end, a 20X forward multiple on 2025 EPS estimates of $290 implies a 2024 price target for the market of 5,800 – about 33% above where we currently trade. 

Either way, if 2025 EPS estimates are to be believed, then stocks have huge upside potential over the next 15 months. 

To me, the key phrase from Luke is “so long as those [earnings] estimates prove true.”

And that brings us full circle to the Toxic Trifecta from earlier in today’s Digest

The 10-year Treasury yield, a loose proxy for borrowing costs, impacts how much companies must pay to finance their growth – affecting earnings…

The cost of oil directly impacts countless corporate Profit & Loss statements by pushing operating expenses higher – affecting earnings…

And the climbing U.S. Dollar undercuts the value of profits generated outside U.S. borders due to currency headwinds – affecting earnings…

The big question is “how much?”

If we see relief from the Toxic Trifecta as we head into 2024, then bullish earnings estimates have a far better shot at materializing.

Now, though we’ve just been talking about long-term earnings, our most immediate clue will come from Q3 earnings season that begins in two weeks with the big banks reporting. JPMorgan will post its results on Friday the 13th. Let’s try not to read anything into that date.

Here’s Luke’s market forecast to take us out:

We believe the Fed will shift toward dovishness, but it will take weeks (not days) and several weak economic reports (not just one) to get it to embrace such a stance. 

Once it does, stocks will rally. But until then, stocks will remain choppy – hence our short-term cautious but medium- and long-term bullish outlooks…

But on a medium-/long-term basis, everything still looks very healthy. 

So, just embrace this volatility because it will create opportunity. Not yet. But soon. And when the bottom does arrive – likely in October – the rally on the other side will be very big and very fast. 


Thursday, May 25, 2023

AI to power the next bull run?


AI Is Sending Tech Stocks to the Moon

In the early 1990s, it was the internet. The world’s first website was launched in August 1991. Wall Street started to grow really excited about the internet’s economic potential. Internet stocks like Cisco (CSCO) and Oracle (ORCL) rose more than 100% in 1991. 

In the early 2020s, it is AI. The world’s first true AI application was launched in November 2022 with ChatGPT. Ever since, Wall Street has become obsessed with AI’s economic potential. Leading AI stocks like C3.ai (AI) have jumped more than 100% so far in 2023. 

The parallels are too strong to dismiss – and the comparison has strong implications for investors. 

The 1991/92 stock market crash and subsequent internet-powered rebound set the stage for the biggest tech bull market the world has ever seen. From 1992 to 1999, the entire Nasdaq Composite rallied nearly 600% as investors salivated over the long-term economic potential of the internet. 

We believe the data suggests that the 2022/23 stock market crash and subsequent AI-powered rebound similarly set the stage for a huge tech bull market to develop over the next several years. We wouldn’t be surprised to see the Nasdaq pop more than 500% between 2023 and 2030 as investors salivate over the long-term economic potential of AI. 

quantum computing

In other words, we think AI is about to power another dot-com boom in tech stocks. 

If so, savvy investors could make fortunes over the next few years. 


Saturday, April 29, 2023

The time to buy semiconductors is now! (adapted from Fundsupermart)


Stop trying to catch the bottom. The time to start buying semiconductor stocks is now

In this article, we revisit our investment thesis for chipmakers and remind investors why the semiconductor industry should always be on your watch list.

  •  
  • |
  •  
  •  Published on 21 Apr 2023

Stop trying to catch the bottom. The time to start buying semiconductor stocks is now | Open a FREE FSMOne account and manage all your investments conveniently in ONE place
Photo by Praveen on Unsplash

Semiconductor stocks have been on a ferocious rally, rising by more than 20% year-to-date. Earnings estimates, however, have not managed to keep up, and that has led to more expensive valuations for chipmakers. 

The semiconductor industry is currently in a down-cycle. We expect sales growth to fall further in the coming quarters as the inventory correction continues.  

Down-cycles do not last forever, and sales will eventually recover to higher levels than before. The long-term structural trends that underpin semiconductor demand remain intact as well. 

The best buying opportunities come about during down-cycles. Even though valuations are not the cheapest at the moment, investors can consider building a position using a regular savings plan, before switching to lump-sum investments in the future. 

Our target price for the VanEck Vectors Semiconductor ETF is USD 317, which represents an upside potential of close to 26% as of 20 April 2023.


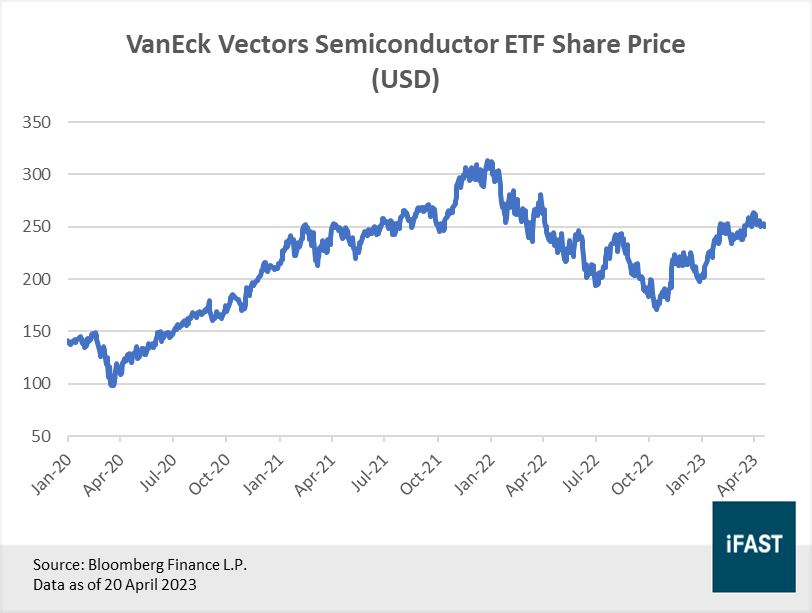
Lately, chip stocks have been on a ferocious rally. The VanEck Vectors Semiconductor ETF (NASDAQ:SMH) – a basket of 25 US-listed semiconductor stocks – has risen by more than 20% year-to-date, placing the semiconductor industry among one of the top-performing sectors this year (Figure 1). However, as earnings estimates have not been able to keep up with the surge in share prices, valuations for the sector have become expensive once more. This is a headache for those who have been sitting on the sidelines, waiting for an opportunity to take a position. 

We are here to tell you that there are still ways for you to do so, but more importantly, remind investors why it is in your interest to always have this sector on your watch list. 


Figure 1: Share prices of chipmakers have risen by about 20% since the start of the year


The semiconductor industry is currently in a down-cycle 

On the whole, 2022 has been a superb year for the entire US chipmaking industry, with record-high revenues and double-digit earnings growth the norm for many players. Unfortunately, good times will not last forever and by the second half of the year, there were clear signs that the industry was sliding into a downturn. 

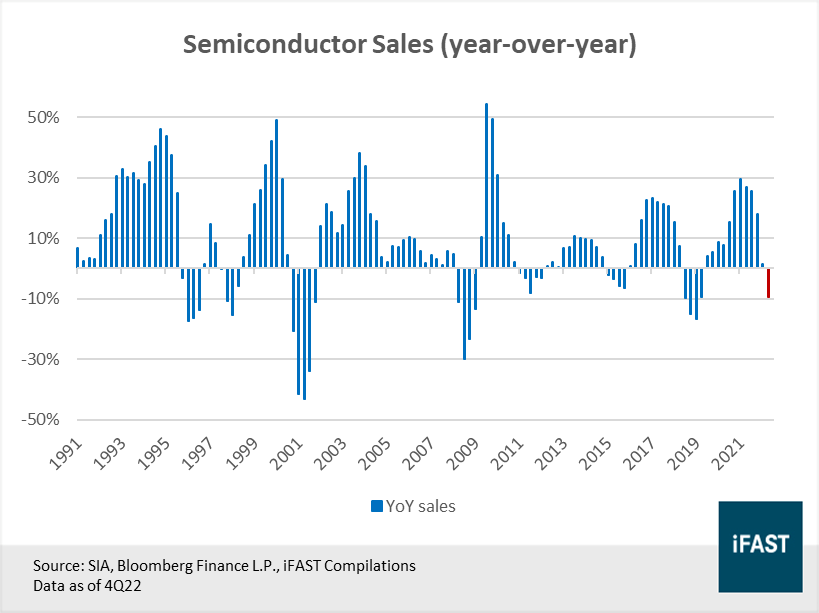
Most notably, semiconductor sales growth turned negative for the first time since 2019, falling by close to -10% in the fourth quarter of 2022 (Figure 2). If we look at things on a monthly basis, we can see that sales growth first turned negative in September, indicating that the down-cycle probably started way earlier. While the initial drop in sales was already significant, things will likely worsen over the coming quarters as the down-cycle plays out – which is bad news for semiconductor stocks. 


Figure 2: Semiconductor sales fell by nearly -10% in the fourth quarter of 2022


While there are a number of reasons that can explain why sales growth has been falling, most can be linked to imbalances in supply and demand. As most people were stuck at home during the early days of the pandemic, trends such as remote working were starting to gain traction resulting in heavy demand for consumer electronics. Many businesses also used the pandemic as an opportunity to digitalise their operations. The end result is an unusually high demand for chips, so much so that it caused a shortage. 

Facing pressure from governments and customers to alleviate the shortage, nearly all major chipmakers made commitments to expand capacity. As a matter of fact, the total industry capex grew by a staggering 26.7% CAGR in 2021 and 2022, significantly higher than the growth rate of 5.8% in the three years prior to the pandemic (Figure 3). Not surprisingly, this sudden and sharp increase in capex resulted in a supply glut. However, the timing could not be worse as this supply glut has come right when chip demand is dissipating rapidly, resulting in the down-cycle we are in today. 


Figure 3: Huge surge in capex across 2021 and 2022 has resulted in a supply glut


Short-term pain for chipmakers as inventory correction continues  

It is no secret that the economy today is on a much weaker footing compared to the beginning of 2022. Persistently high inflation, coupled with aggressive central bank policy, has slowed economic activity substantially, raising the risk of a recession. The recent collapses of Silicon Valley Bank and several other regional lenders are also evidence that tighter monetary policy is starting to bite, adding to concerns about the health of the economy. 

Thanks to the greater economic uncertainty, chip demand has fallen drastically. Trapped between high inflation and borrowing costs, consumers have been cutting back on spending. According to data published by IDC, shipments of consumer electronics, such as PCs, smartphones, and wearables have all declined in 1Q23.

Among the various players, Apple’s Mac shipments plunged by more than -40% (the worst among the lot) as consumers traded down for cheaper alternatives. With the pandemic boom behind us and a global recession looming, shipments of consumer electronics are likely to remain weak for the foreseeable future.

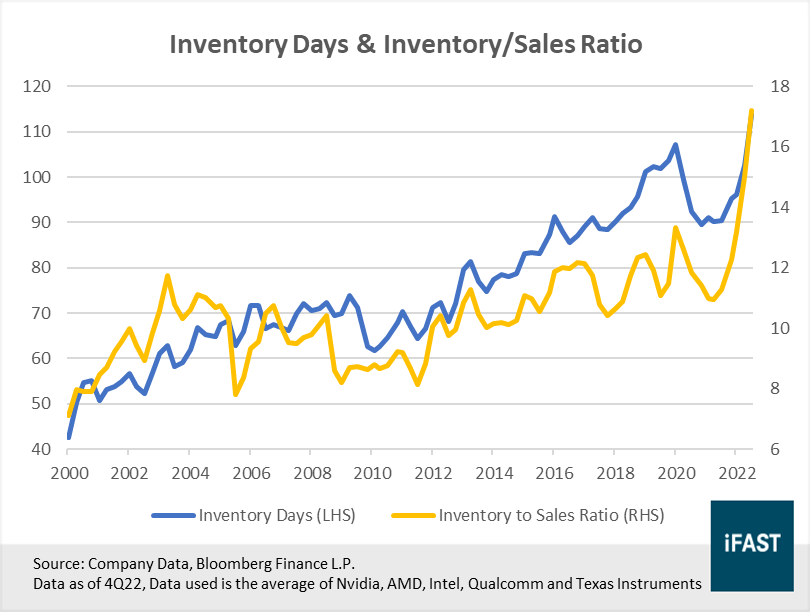
To make matters worse, inventory channels are bloated, likely because many customers double-ordered during the shortage. Taking a quick look at the numbers for the top five chipmakers in the US, we can see that inventory days (the average number of days a firm takes to sell off inventory) and inventory-to-sales ratio have both been rising. Both measures indicate that turnover has been slowing (Figure 4). 


Figure 4: Inventories have been rising among semiconductor companies as demand shrank


With demand falling and inventories rising, chipmakers will likely halt new orders and slash prices to get rid of excess inventory. Samsung said that it will meaningfully reduce production levels after a pileup in inventory and a collapse in memory chip prices caused the company to report the worst operating profit since the global financial crisis. 

TSMC is also bracing for weaker sales by cutting its capex spending. The company expects first quarter revenue to be about -15% lower and operating margins to fall by about -10%. According to the management, this inventory correction will likely last throughout the year and things should start to pick up in 2024. 


Related article: Running out of investment ideas? Here’s one that can bag you a 55% profit even in a recession


Down-cycles are temporary, long-term growth story remains intact 

The good news here is that down-cycles do not last forever. Despite the current downturn, we are confident that semiconductor sales will eventually recover to higher levels than before as it had done so every single time in the past. Therefore, it is not a question of whether or not a recovery will occur, but rather a question of when will the recovery take place. By our estimates, we think that the industry could return to double-digit growth as early as 2024. 


Figure 5: Semiconductor sales have always bounced back to higher levels than before post-downturn


According to estimates from McKinsey, the semiconductor industry is poised to become a trillion-dollar industry by 2030, which represents an annual growth rate of roughly 6-8%. Demand for chips is set to be driven by structural factors such as (i) an increase in the number of semiconductor applications, and (ii) the increase in silicon content in them.

These days, the use of semiconductors has become widespread. Recent innovations such as ChatGPT and the metaverse were only made possible because of advancements in semiconductor technology. Apart from this, the silicon content in most existing applications has also increased significantly over the years. 

Take cars for instance. Even though they were still largely mechanical since the start of the 21st century, thanks to new innovations such as autonomous driving, the silicon content of cars today is estimated to have grown by more than five times compared to a decade ago, and is still expected to grow even further. According to projections by Intel, semiconductors will make up more than 20% of a vehicle’s cost by 2026, a fourfold increase from 2019!  

The bottom line is this: as the world becomes increasingly tech-driven, chip demand will only become even stronger than before. This will bring immense benefits to the entire industry as a whole.


Downturns bring about the best buying opportunities

Down-cycles in the semiconductor industry come about once every few years. When they do, it is a buying opportunity not to be missed. While it is in our nature as investors to try and pick the exact bottom of the cycle, it is almost impossible to do so except in hindsight or with the help of sheer luck. Often, investors waiting to catch the cycle bottom end up missing out on the opportunity altogether. 

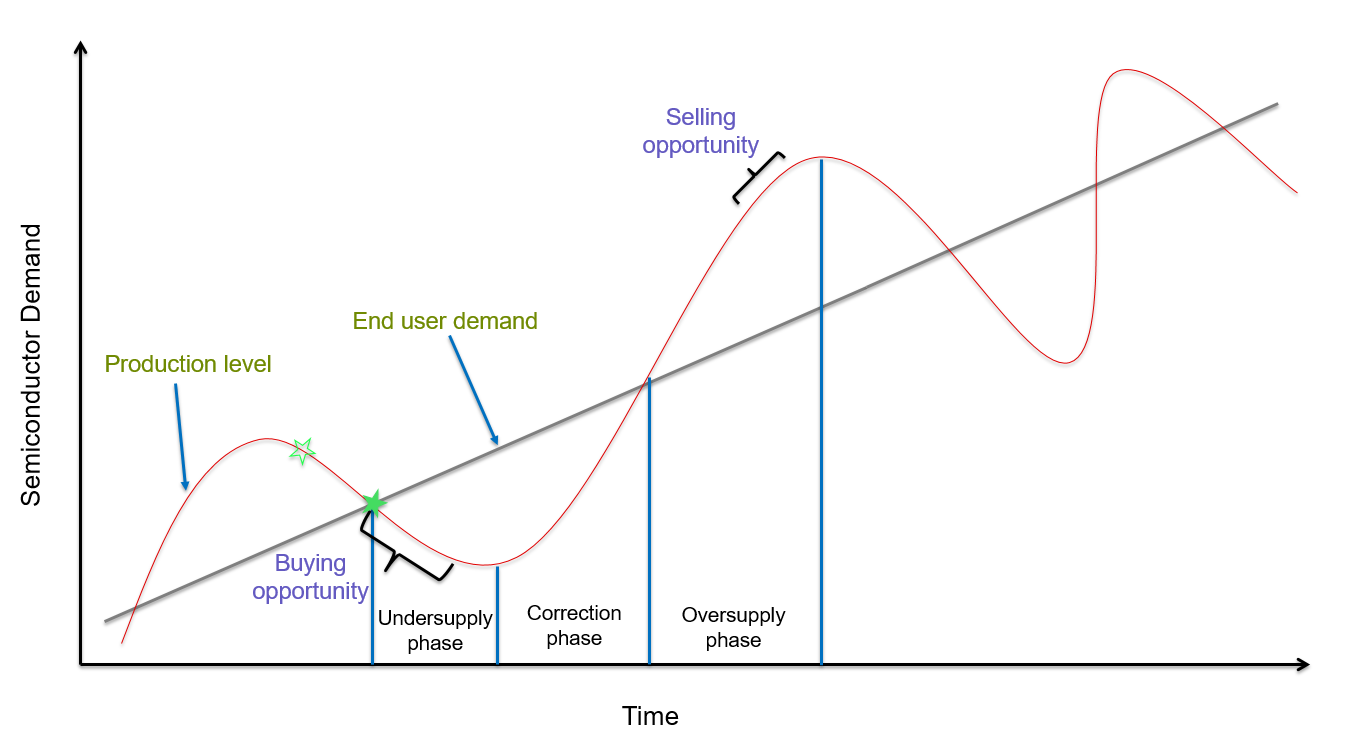
So instead of trying to pinpoint where the bottom is, what we can do is identify a range of buying opportunities in the cycle. In our opinion, the best time to start accumulating semiconductor stocks is during the start of down-cycles, when share prices are falling and manufacturers are cutting back on production (such as now). As scary as things may seem today, down-cycles can be a great opportunity to pick up shares at a discount.


Figure 6: Downturns bring about the best buying opportunities 

Source: iFAST


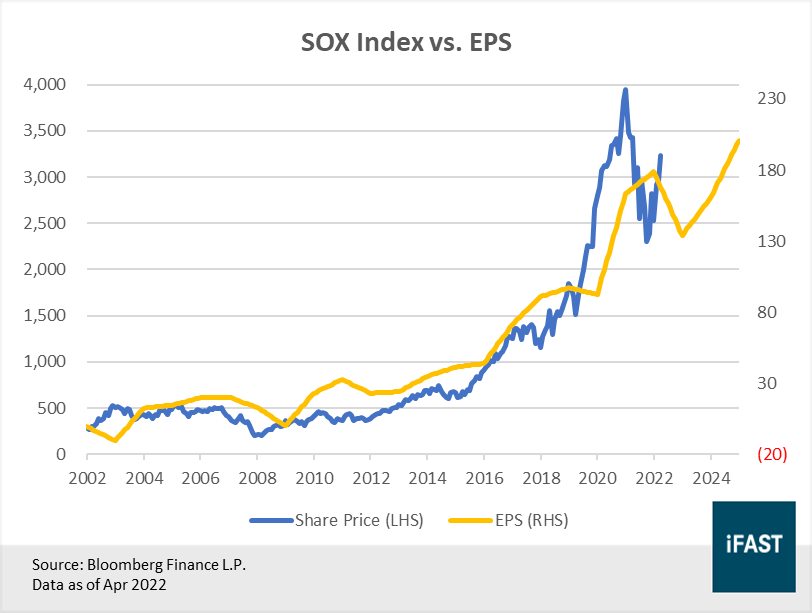
Even though valuations are not the cheapest at the moment and there is also the risk that share prices may tumble further, we believe that there is definitely long-term value within this industry. Stretching our investment horizon out further, valuations are not nearly as daunting as they are today – trading at just 15.8X 2025E EPS versus our fair PE multiple of 20X. This implies an upside of roughly 26%, and a target price of USD 317 for the VanEck Vectors Semiconductor ETF (NASDAQ:SMH).


Table 1: Valuations are not as daunting if investors think long-term 

MVSMHTR Index 

2022

2023E

2024E

2025E

Earnings Per Share (EPS)

282.86

212.15

254.57

318.22

Earnings Growth YoY

26.30%

-25.00%

20.00%

25.00%

PE Ratio (X)

14.40

23.73

19.78

15.82

Upside Potential

(based on fair PE Ratio of 20.0X)

-

-

-

26.40%

Source: Bloomberg Finance L.P., iFAST Compilations.

Data as of 20 Apr 2023


It is difficult to imagine a future without semiconductors. 

For an industry with such solid fundamentals, the growth prospects are simply immense. While we understand that conservative investors may want to wait for more clarity before buying in, longer-term investors can start building a position today using a regular savings plan, before switching to lump sum investments should valuations fall further.

Alternatively, investors may also consider single-stock names such as TSMC (NYSE:TSM), which trades at lower valuations relative to the broader US semiconductor industry. 


Figure 7: Share prices are driven by earnings in the long run